
The Blackwell Migration Question
When you should move Llama 3.3 70B inference from H100 to B200, when you should not, and what the real cost-per-token improvement is once you do.


Introduction
A single Blackwell B200 running Llama 3.3 70B at NVFP4 can decode at approximately 5.5 milliseconds per token at batch size 1, an 18-month-old H100 at FP8 cannot move below 21.5 ms. The B200 floor is roughly 4× faster and the KV-cache budget grows by about 18×.
The numbers are not vendor marketing. They are bandwidth arithmetic: 7.7 TB/s of HBM3e divided by a ~43 GB on-GPU footprint for the FP4 weights, the same first-principles derivation we used for the H100 floor in Issue #1, with two parameters changed.
The question that follows is not whether Blackwell is faster. It is whether the price-per-token improvement actually delivered to a deployment engineer justifies the migration cost, and the published vendor numbers do not answer it cleanly.
NVIDIA’s October 2025 announcement of SemiAnalysis InferenceMAX v1 claims “15× lower cost per million tokens” for Blackwell vs Hopper.
The real cost-per-token improvement for like-for-like single-GPU Llama 3.3 70B inference, derived from the same InferenceMAX v1 data combined with public on-demand pricing, is closer to 3× on-demand and 8× on spot, with the gap explained by rack-scale GB200 NVL72 comparisons, MoE workloads, and BF16-baseline framings that do not represent the H100 FP8 production deployment most readers are actually running.
This is Issue #2 of what is now called Inference.Engineering. Issue #1 derived the bandwidth-bound floor for Llama 3.3 70B FP8 on H100 SXM5, audited the public benchmark landscape, identified where the engine-vs-engine variance actually lives, and committed to running our own measurements.
The measurement work is in progress and ships separately. This issue addresses the question deployment engineers are asking now: should I migrate, and what do I actually get if I do.
The post does what Issue #1 did. It derives the physical bounds from the NVIDIA datasheet and the FP4 weight footprint. It places the bounds against empirical data from SemiAnalysis InferenceMAX v1 and NVIDIA’s MLPerf v4.1 submission.
It audits the public Blackwell benchmark claims against those bounds, reads the kernel-layer story underneath (NVFP4 vs MXFP4, the second-generation Transformer Engine, FlashAttention-3 on SM100 vs SM90, NVLink 5), works through the quantization-accuracy tradeoff using Red Hat AI’s published evaluation of NVFP4 on Llama 3.3 70B, and concludes with a migration decision matrix for the six most common production situations.
A note on what we have and have not done. This post is analysis grounded in primary-source data. The bounds are calculator-checkable. The empirical numbers come from SemiAnalysis InferenceMAX v1 (October 2025), NVIDIA’s own MLPerf submission, Red Hat AI’s published NVFP4 evaluation, and the vLLM v0.12.0 Blackwell recipe page.
We have not yet run our own B200 benchmarks. When we do, this post will be updated and any deltas will be tracked in the errata page. If the migration recommendations below turn out to be wrong when measured directly, cite this post against us.
Inference.Engineering is reader-supported. The paid subscription funds rented GPU time on H100, B200, and MI355X, which is how we plan to measure the configurations this issue discusses.
Key observations
Decode floor on a single B200 for Llama 3.3 70B NVFP4 is ~5.5 ms/token at batch 1, a per-user throughput ceiling of ~180 tok/s/user. Derived from ~43 GB on-GPU footprint at NVFP4 (34 GB FP4 linear weights + ~4 GB BF16 embedding/lm_head + ~4 GB block-scale overhead at NVFP4’s 16-element block size) divided by 7.7 TB/s HBM3e bandwidth on the HGX B200. The GB200 variant at 8.0 TB/s reaches ~5.3 ms.
The B200’s KV-cache budget after NVFP4 weights is ~135 GB on a single 180 GB HGX B200 GPU, versus ~7–8 GB on a single 80 GB H100 at FP8. The 18× increase is the load-bearing fact, not the throughput number. Long-context workloads that hit the KV wall on H100 (Part 1.2 of Issue #1) move comfortably into single-GPU territory on B200.
NVFP4 on Llama 3.3 70B is essentially lossless when properly calibrated. Red Hat AI’s published NVFP4 evaluation (February 2026) shows large models (70B–235B parameters) “consistently achieve ~99% recovery” of BF16 accuracy across task-level and aggregate benchmarks. This holds for Llama 3.3 70B specifically; the published RedHatAI/Llama-3.3-70B-Instruct-NVFP4 checkpoint exists with full reproduction recipes.
NVFP4 ≠ MXFP4. On Llama 3.3 70B with quantized KV cache, NVIDIA measures 5% higher MMLU accuracy with NVFP4 vs MXFP4 (December 2025), attributed to NVFP4’s finer block scaling (16-element blocks vs 32) and higher-precision E4M3 FP8 scaling factors vs MXFP4’s E8M0. The distinction matters: a benchmark reporting “FP4” without specifying which format does not generalize.
SemiAnalysis InferenceMAX v1 reports B200 delivering ~10,000 TPS/GPU at 50 tok/s/user interactivity on Llama 3.3 70B, roughly 4× higher per-GPU throughput than H200 at the same interactivity (NVIDIA blog, October 9, 2025). Note that the batch-1 decode-floor ratio vs H200 is smaller (~2.7×, from 1.6× bandwidth times 1.69× NVFP4 footprint); the larger 4× at production interactivity additionally captures the bigger batch sizes the B200’s KV headroom permits and the FP4 compute density that helps once batches are large. Floor and interactivity-point throughput are different metrics, and the gap between them is itself informative.
NVIDIA’s “15× lower cost per million tokens” headline is not the right number for the single-GPU H100 → B200 question. It applies to rack-scale GB200 NVL72 on MoE models compared to HGX H100 air-cooled clusters at BF16. For like-for-like single-GPU Llama 3.3 70B FP8 (H100) vs NVFP4 (B200) at 50 tok/s/user interactivity, the derived cost-per-million-tokens improvement using Spheron’s published rates is ~3× on-demand and ~8× on spot.
The B200’s compute-bandwidth ridge sits at 2,338 FLOPs/byte for FP4 dense (18 PFLOPS / 7.7 TB/s) on the HGX variant, versus 591 FLOPs/byte at FP8 on H100. The Blackwell ridge is roughly 4× further out, meaning Llama 3.3 70B decode at AI ≈ 1 FLOP/byte sits even further below the ceiling. Decode is more bandwidth-bound on B200, not less. The throughput improvement comes from the bandwidth itself, not from compute throughput.
vLLM v0.12.0 is the current Blackwell-ready release. NVIDIA’s vLLM recipe page is direct on the precision choice: “For Hopper, FP8 offers the best performance for most workloads. For Blackwell, NVFP4 provides additional memory savings and throughput gains, but may require tuning to maintain accuracy on certain tasks.” The recipe also documents
kv-cache-dtype: fp8andmax-num-batched-tokens: 8192as the recommended Llama 3.3 70B Blackwell defaults.The B200’s 1,000W TDP requires infrastructure most data centers do not yet have. H100 SXM5 runs at 700W in air-cooled configurations. B200 at 1,000W in HGX form (or 1,200W in GB200) frequently requires liquid cooling or a substantial reduction in rack density. The migration cost includes infrastructure, not just hardware.
The cross-vendor portability story is real and underappreciated. vLLM’s Triton attention backend, which achieved 100.7% of FlashAttention-3 performance on Hopper for long decode requests (Issue #1, Section 4.2), runs unchanged on Blackwell and AMD. The same Triton kernel that closes the gap to FA3 on H100 also closes the gap to FA4 on B200. A migration evaluation that compares only the NVIDIA-optimized stack systematically understates the AMD alternative on the workloads where Triton attention wins.
The B200 supply situation matters for the timeline. Inworld reports B200 hardware orders backlogged through mid-2026 with ~3.6 million units in queue (April 2026 reference). Cloud rental is the practical migration path for most readers in 2026, not on-premise purchase. This makes the spot-price economics more relevant than the list-price comparisons NVIDIA’s blog posts emphasize.
Part 1, The physical bounds on Blackwell
Three numbers belong on every Llama 3.3 70B / B200 deployment engineer’s whiteboard: the decode latency floor under NVFP4, the KV-cache budget that the larger HBM3e capacity unlocks, and the compute roofline ridge that shifts under the second-generation Transformer Engine.
1.1 The decode latency floor under NVFP4
The bandwidth-bound floor derivation from Issue #1 transfers unchanged. Decode on a single B200 streams the full weight set from HBM3e to the SMs per token.
At batch 1, decode arithmetic intensity remains ~1 FLOP per byte loaded (Spector & Ré; arXiv 2603.05931). The H100 figures from Issue #1 become Blackwell figures by substituting the new weight footprint and the new bandwidth.
NVIDIA B200 datasheet figures, cross-verified against the official December 2024 Blackwell datasheet:
Metric HGX B200 (per GPU) GB200 (per GPU) HBM3e bandwidth 7.7 TB/s 8.0 TB/s FP4 dense 18 PFLOPS 20 PFLOPS FP8/FP6 dense 9 PFLOPS 10 PFLOPS BF16/FP16 dense 5 PFLOPS 5 PFLOPS HBM3e capacity 180 GB 186 GB TDP 1,000 W up to 1,200 W NVLink generation 5 (1.8 TB/s) 5 (1.8 TB/s)
(All Tensor Core figures are dense; sparse values are 2× the dense.)
Llama 3.3 70B on-GPU footprint under NVFP4 decomposes as follows. NVFP4 quantizes linear-layer weights to 4 bits per parameter in 16-element blocks with one E4M3 FP8 scale per block. Embedding and lm_head remain in BF16 (the standard production path that Red Hat AI’s checkpoint uses, mirroring the FP8 convention from Issue #1):
Linear FP4 weights:        68.45B params × 0.5 bytes = 34.23 GB
Block-scale overhead:      68.45B params / 16 × 1 byte = 4.28 GB
Embedding + lm_head BF16:  2.10B params × 2 bytes = 4.20 GB
Runtime + activations + CUDA graphs: ~1 GB
                                              ---------
Total on-GPU footprint:                      ~43.7 GB
The lower bound on decode latency per token at batch 1 uses the per-token streaming footprint of ~42.7 GB (the FP4 linear weights, their block scales, and the BF16 lm_head, all of which stream from HBM every decode step).
The extra ~1 GB of runtime and activation buffers in the ~43.7 GB total does not stream per token, so it enters the KV-budget subtraction in Part 1.2 but not the floor:
HGX B200:  t_floor = 42.7 GB / 7.7 TB/s  ≈ 5.5 ms/token
           v_ceiling = 1 / t_floor       ≈ 180 tok/s/user

GB200:     t_floor = 42.7 GB / 8.0 TB/s  ≈ 5.3 ms/token
           v_ceiling = 1 / t_floor       ≈ 187 tok/s/user
Comparing to the H100 SXM5 / FP8 reference from Issue #1 (~21.5 ms / 46.5 tok/s/user), the Blackwell + NVFP4 combination delivers a roughly 4× decode-floor improvement at batch 1. The improvement decomposes into two contributions: bandwidth (7.7 vs 3.35 TB/s = 2.3×) and streaming footprint (42.7 vs 72 GB = 1.69×).
The footprint contribution is what makes NVFP4 valuable, separate from the hardware. Running B200 with FP8 weights instead of NVFP4 would cut the footprint contribution to ~1× and recover only the 2.3× bandwidth improvement.
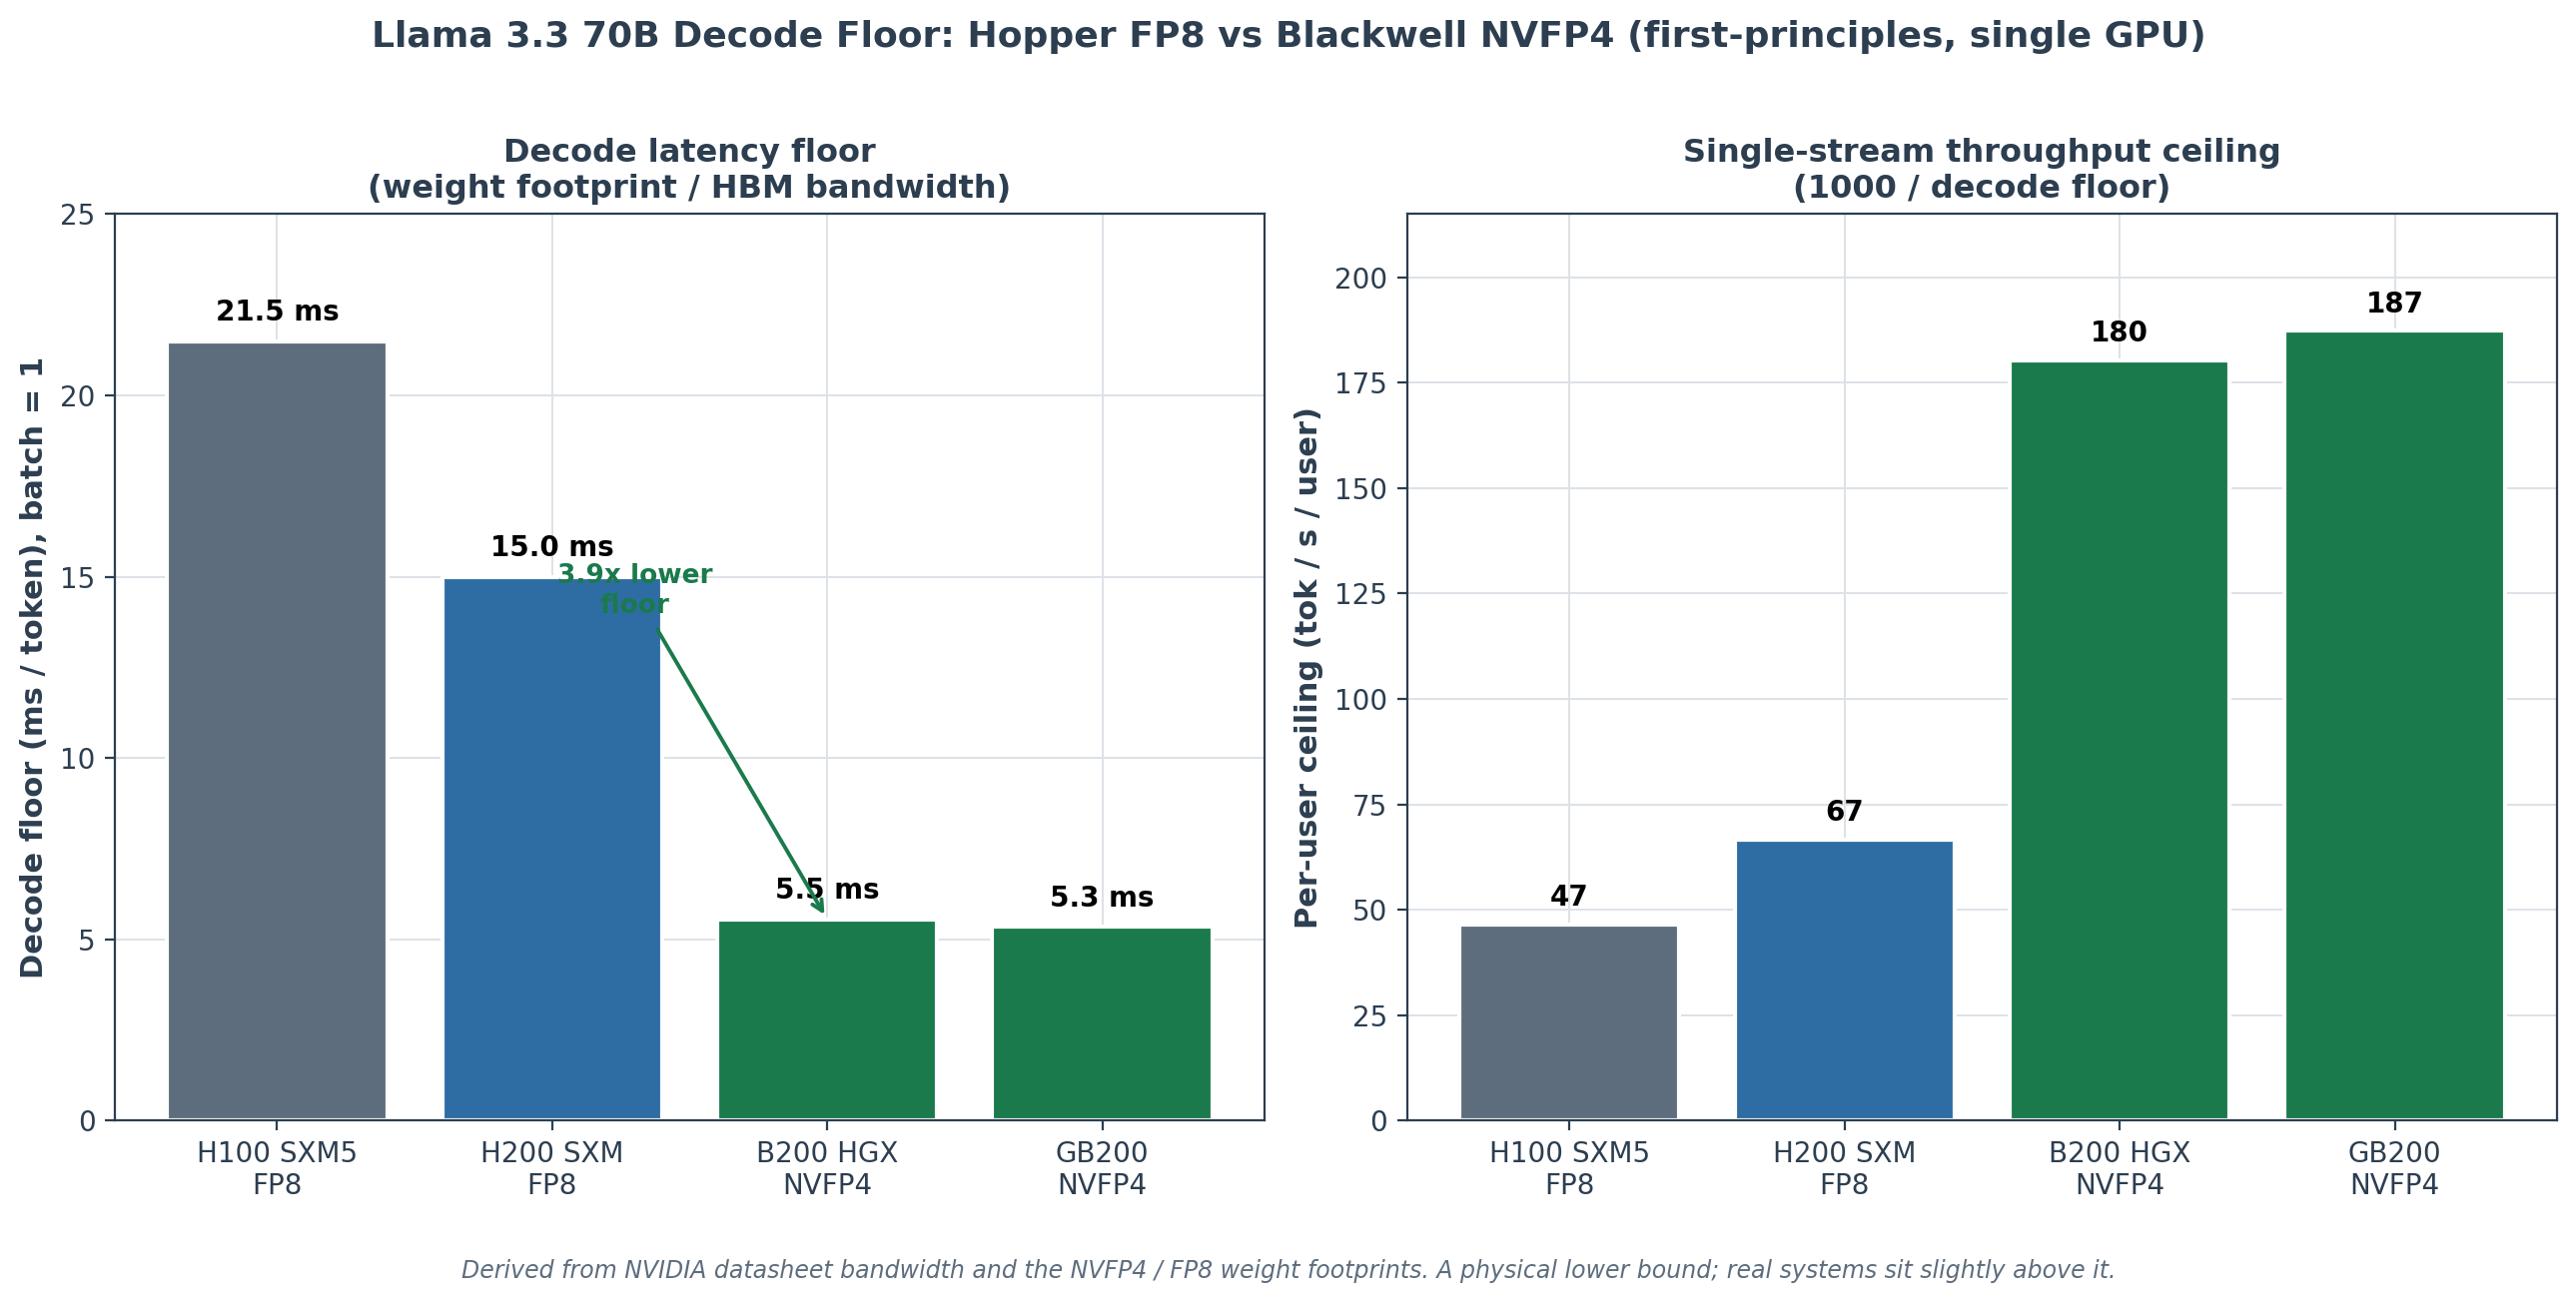
Chart 1. The decode latency floor and the per-user throughput ceiling it implies, derived from each GPU’s HBM bandwidth divided by the Llama 3.3 70B weight footprint at the relevant precision. B200 NVFP4 is ~3.9x faster at the floor than H100 FP8. These are physical lower bounds; real systems sit slightly above them.
Verify the floor yourself. The bound is checkable on any rented B200 in under ten minutes, using NVIDIA’s vLLM v0.12.0 Blackwell recipe as the launch baseline:
docker pull vllm/vllm-openai:v0.12.0

docker run --gpus all -p 8000:8000 vllm/vllm-openai:v0.12.0 \
  --model nvidia/Llama-3.3-70B-Instruct-NVFP4 \
  --kv-cache-dtype fp8 \
  --max-num-batched-tokens 8192 \
  --gpu-memory-utilization 0.9
Then measure single-stream decode at concurrency 1:
vllm bench serve \
  --model nvidia/Llama-3.3-70B-Instruct-NVFP4 \
  --dataset-name random --random-input-len 512 --random-output-len 512 \
  --max-concurrency 1 --num-prompts 8 \
  --percentile-metrics ttft,tpot,itl,e2el --ignore-eos
NVIDIA also publishes the canonical reproduction in its dgxc-benchmarking repository, which runs Llama 3.3 70B inference with --dtype nvfp4 on B200/GB200 and exposes TPOT directly when streaming is enabled (STREAMING=true);
the same harness runs the H100 baseline at --dtype fp8, making it the cleanest apples-to-apples generational comparison available without writing your own client.
Expected mean TPOT should land in the ~6–8 ms range on HGX B200, at or just above the 5.5 ms floor, with the ~1–2 ms gap being engine overhead and kernel-launch latency. If you see TPOT materially below 5.5 ms at batch 1, the engine is running speculative decoding or sub-NVFP4 weights.
If materially above ~10 ms, the precision path is wrong (the engine fell back to FP8 or BF16) or the configuration is wrong (cold CUDA graphs, an unconfigured Transformer Engine path). Per-user throughput is 1000 / TPOT_ms.
A caveat we will not paper over. Unlike Issue #1, where NVIDIA’s own NIM benchmark published the H100 throughput-vs-concurrency curve that empirically confirmed the KV wall, we have not located a published single-stream (batch-1) B200 TPOT measurement for Llama 3.3 70B NVFP4 to anchor the 5.5 ms floor directly.
The public B200 numbers (InferenceMAX, MLPerf, the TRT-LLM perf tables) are all aggregate-throughput or production-interactivity points at large batch, not batch-1 latency. The 5.5 ms figure is therefore a bandwidth derivation, not yet an empirically confirmed measurement, and confirming it within 15% is the first specific claim Issue #3 will test.
Treat it as a physical lower bound that real systems approach from above, exactly as the H100 floor behaved before NIM data confirmed it.
1.2 The KV-cache budget grows by an order of magnitude
The KV-cache calculation transfers unchanged from Issue #1. Llama 3.3 70B uses Grouped-Query Attention with 8 KV heads, head_dim 128, across 80 layers. Per-token KV-cache footprint is ~327 KB at BF16 or ~164 KB at FP8.
After loading the ~43.7 GB NVFP4 weight footprint and reserving ~1 GB for runtime, the KV-cache budget on a single 180 GB HGX B200 is approximately 135 GB, versus ~7–8 GB on a single 80 GB H100 at FP8:
KV precision Bytes/token KV tokens on H100 (~7–8 GB) KV tokens on B200 HGX (~135 GB) BF16 327 KB ~21,000–24,500 ~413,000 FP8 164 KB ~42,000–49,000 ~825,000
At avg_seq_len = 8,192 tokens (the vLLM V1 default chunked-prefill budget), single-H100 concurrency is ~3. Single-B200 concurrency is ~50 at the same configuration. At avg_seq_len = 32,768 (long-context agentic workloads), single-H100 supports less than one full request in memory; single-B200 supports ~12.
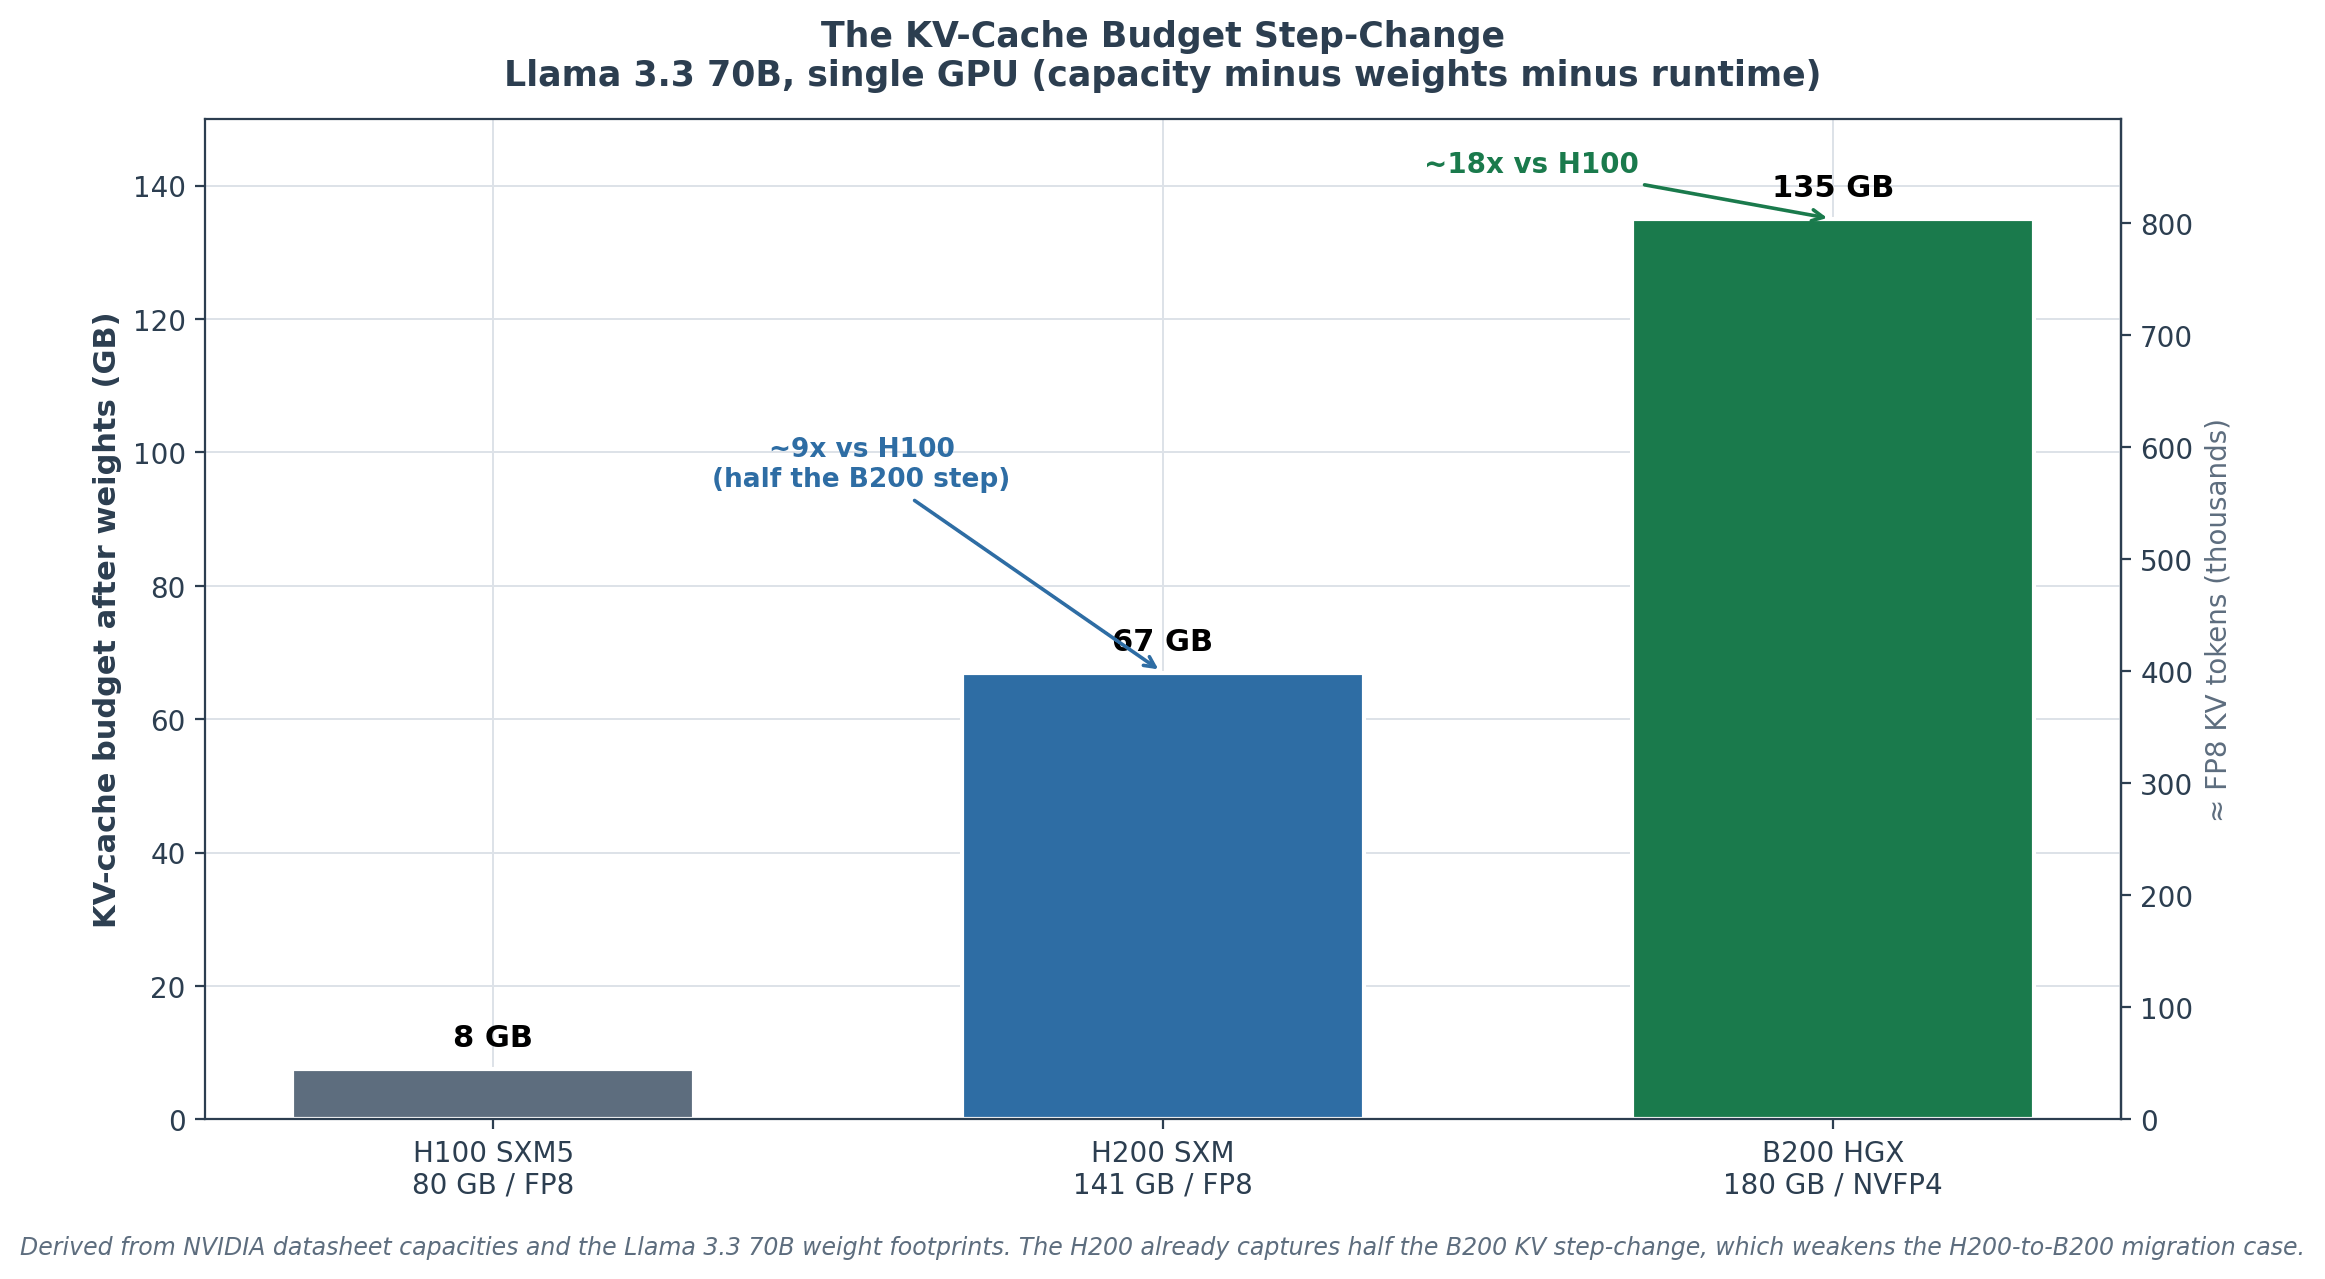
Chart 2. KV-cache budget remaining after weights load, single GPU. The B200’s ~135 GB is ~18x the H100’s ~7.5 GB. Note that the H200 already reaches ~67 GB (~9x), capturing half the step-change, which is why an existing H200 fleet has a weaker migration case than an H100 fleet (Part 6.1).
This is the load-bearing finding of the Blackwell migration question for long-context production: the workloads that required TP=2 or TP=4 on Hopper for KV headroom fit comfortably on a single B200. The migration changes which workloads are “single-GPU” deployments.
1.3 The roofline shifts further out
The B200 compute-bandwidth ridge moves to:
AI_ridge (B200 FP4 HGX) = 18 PFLOPS / 7.7 TB/s  ≈ 2,338 FLOPs/byte
AI_ridge (B200 FP8 HGX) =  9 PFLOPS / 7.7 TB/s  ≈ 1,169 FLOPs/byte
AI_ridge (H100 FP8)     = 1,979 TFLOPS / 3.35 TB/s ≈ 591 FLOPs/byte
The B200 FP4 ridge is roughly 4× further out than the H100 FP8 ridge. Decode at batch 1 with AI ≈ 1 sits at the same arithmetic intensity but achieves only ~7.7 TFLOPS on B200 (0.04% of FP4 peak), vs ~3.4 TFLOPS on H100 (0.17% of FP8 peak).
The fraction of peak compute used by decode falls as the hardware improves, because the bound is bandwidth, not compute. The Blackwell FP4 compute density is largely irrelevant to batch-1 decode latency; it matters at higher batch and in prefill.
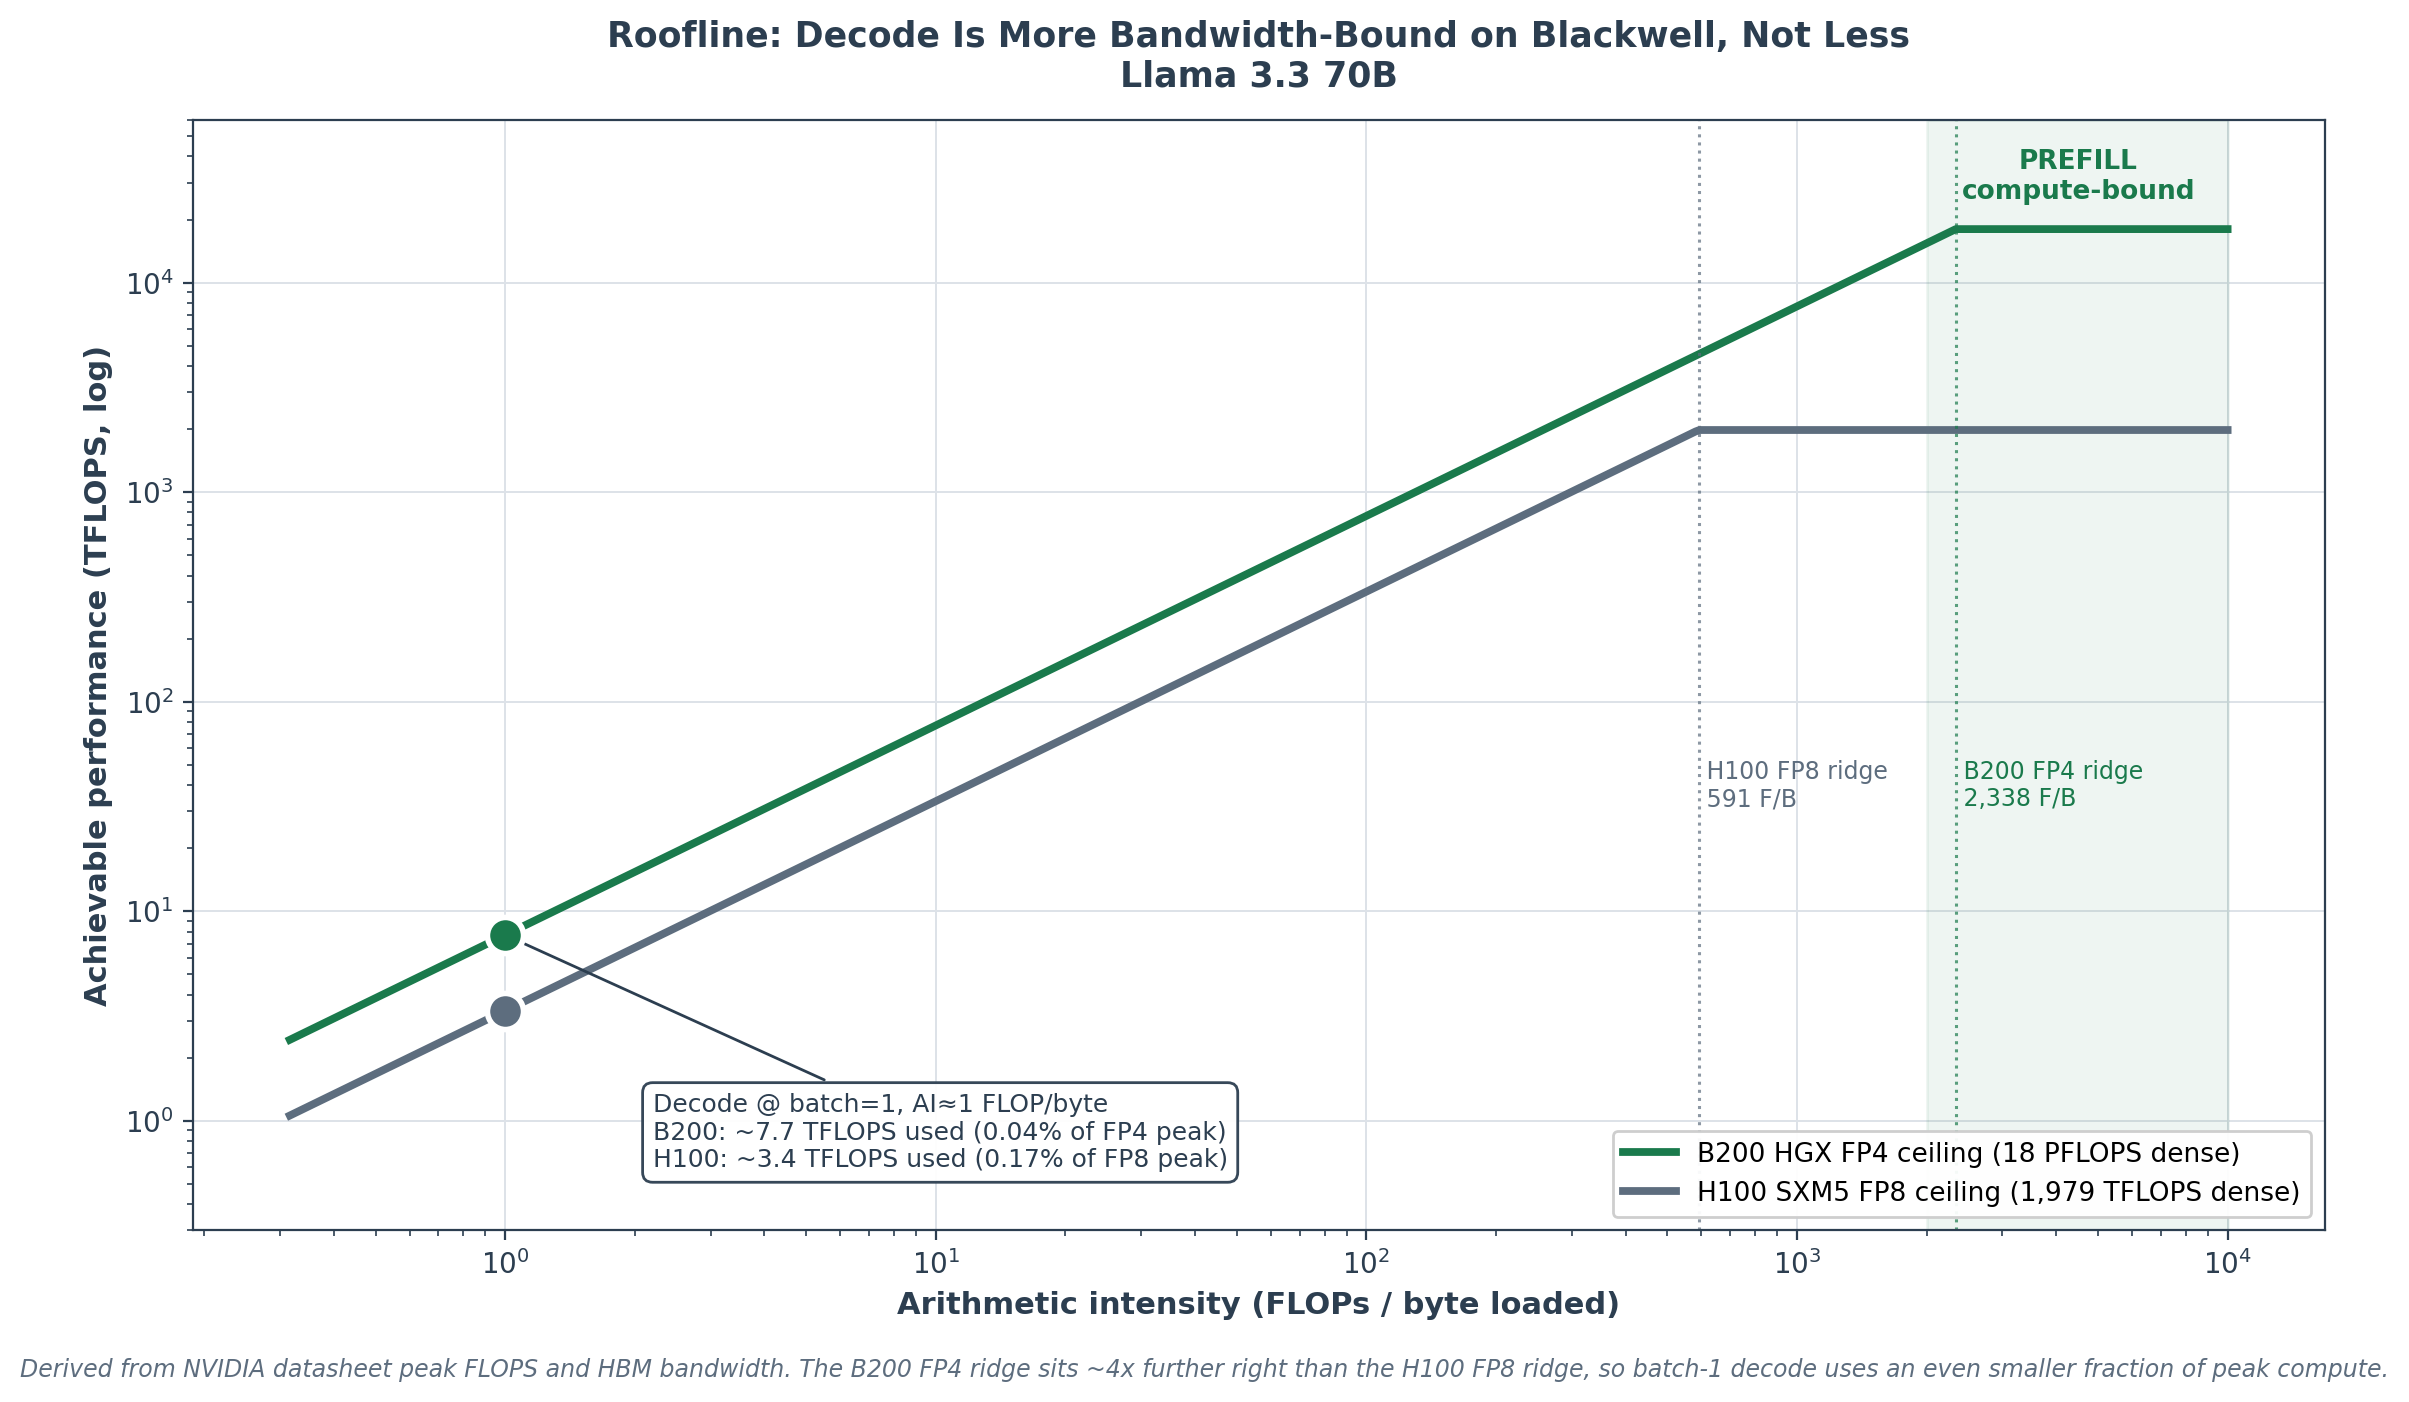
Chart 3. The B200 FP4 compute-bandwidth ridge sits ~4x further right than the H100 FP8 ridge. Batch-1 decode at arithmetic intensity ~1 FLOP/byte uses an even smaller fraction of peak compute on Blackwell (0.04%) than on Hopper (0.17%): the throughput gain is bandwidth, not compute. Compute density only matters in the prefill regime (shaded).
Prefill on B200 at FP4, with arithmetic intensity in the 2,000–10,000 FLOPs/byte range, runs comfortably in the compute-bound regime above the ridge. At 75% utilization on the FP4 ceiling, the per-GPU prefill throughput on Llama 3.3 70B reaches approximately:
prefill_ceiling = 0.75 × 18 PFLOPS / (2 × 70.55 × 10^9 FLOPs/token) ≈ 96,000 tok/s
versus ~10,500 tok/s on H100 at FP8. A ~9× prefill throughput improvement, which dominates the workloads where input length is much larger than output length (RAG, document QA, code understanding).
The bandwidth-bound decode improvement is “only” ~4×; the compute-bound prefill improvement is much larger.
Part 2, Empirical verification from InferenceMAX v1 and MLPerf
The Part 1 derivation predicts a ~4× decode floor improvement and a ~9× prefill ceiling improvement for Llama 3.3 70B going from H100 FP8 to B200 NVFP4. Three empirical sources test the prediction, and getting the comparison right requires understanding precisely how each was measured.
SemiAnalysis InferenceMAX v1 (October 9, 2025) is the most rigorous public source, and its methodology deserves close reading because the headline numbers are easy to misquote.
InferenceMAX runs nightly on hundreds of chips via GitHub Actions, sweeping max-concurrency and parallelism to trace the full throughput-vs-interactivity Pareto frontier rather than reporting a single point.
For each run it uses random sequences (no prefix caching, to avoid the workload-dependent complexity prefix caching introduces), an infinite request rate with a capped max-concurrency, and three input/output sequence-length pairs chosen to represent distinct workload classes: 1K in / 1K out (chat), 1K in / 8K out (reasoning), and 8K in / 1K out (summarization), with each request’s input length randomized to 80–100% of nominal to mimic real traffic variance.
For Llama 3.3 70B specifically, the default engine is vLLM and the Blackwell precision is NVFP4; SGLang is the DeepSeek default and TRT-LLM is run where vendors submit configs.
The InferenceMAX v1 finding on Llama 3.3 70B is unambiguous: “When it comes to LLaMA 70B FP4, B200 significantly outperforms MI355X across all three workload types.” NVIDIA’s accompanying announcement quantifies the generational comparison: Blackwell delivers over 10,000 TPS per GPU at 50 TPS/user interactivity on Llama 3.3 70B, 4× higher per-GPU throughput than H200.
Three things about how this number is constructed, each of which a careless reader gets wrong. First, 50 tok/s/user is a production interactivity floor, not the single-stream maximum.
A B200 at single-stream batch 1 reaches the ~180 tok/s/user ceiling from Part 1.1; the 50 tok/s/user point sits at a higher concurrency where weight loads amortize across many users, which is exactly the throughput-vs-interactivity trade-off that defines the Pareto curve.
Second, the 4× comparison is vs H200, not H100. H200’s 4.8 TB/s bandwidth is ~43% higher than H100’s 3.35 TB/s, so the B200-vs-H100 ratio is correspondingly larger than 4×. Third, the comparison holds NVFP4 on B200 against FP8 on the Hopper part, so the 4× already bundles the precision-footprint contribution; it is not a pure-hardware ratio.
Our derivation decomposes the B200-vs-H100 ratio cleanly: 2.3× from bandwidth (7.7 vs 3.35 TB/s) times ~1.69× from the NVFP4 streaming-footprint reduction (42.7 vs 72 GB) gives ~3.9× at the bandwidth-bound decode floor.
The InferenceMAX 4×-vs-H200 number, adjusted for the H200-to-H100 bandwidth gap, lands in the same region. The decomposition matters more than the point estimate: it tells a deployment engineer that running B200 at FP8 instead of NVFP4 sacrifices the 1.69× footprint term and recovers only the 2.3× bandwidth term.
MLPerf Inference v4.1 is the second anchor. NVIDIA’s August 2024 submission with one B200 GPU on Llama 2 70B reported 10,756 tokens/s server scenario and 11,264 tokens/s offline scenario, against a per-GPU H100 figure derived by dividing the eight-GPU H100 submission by eight, yielding a reported 4× server / 3.7× offline per-GPU increase.
Llama 2 70B and Llama 3.3 70B share the relevant architecture (80 layers, hidden 8192, 64 Q heads, 8 KV heads in 8:1 GQA), so the ratio transfers even though the absolute number is for Llama 2.
The three paths cluster around 4×, though on deliberately different baselines that are worth stating precisely. InferenceMAX v1 (production interactivity, NVFP4-vs-FP8): ~4× vs H200.
MLPerf v4.1 (offline, peak throughput): ~3.7–4× vs H100 per-GPU. First-principles (bandwidth-bound decode floor): ~3.9× vs H100. The two H100-baselined numbers agree tightly at ~3.9×; the InferenceMAX figure is vs the faster H200, so restated against H100 it would be somewhat larger than 4×, meaning the three are mutually consistent rather than coincidentally equal.
Convergence of an independent nightly benchmark, a standardized industry benchmark, and a from-scratch derivation in the same band, with the baseline differences accounted for, is what separates a defensible figure from a vendor claim repeated.
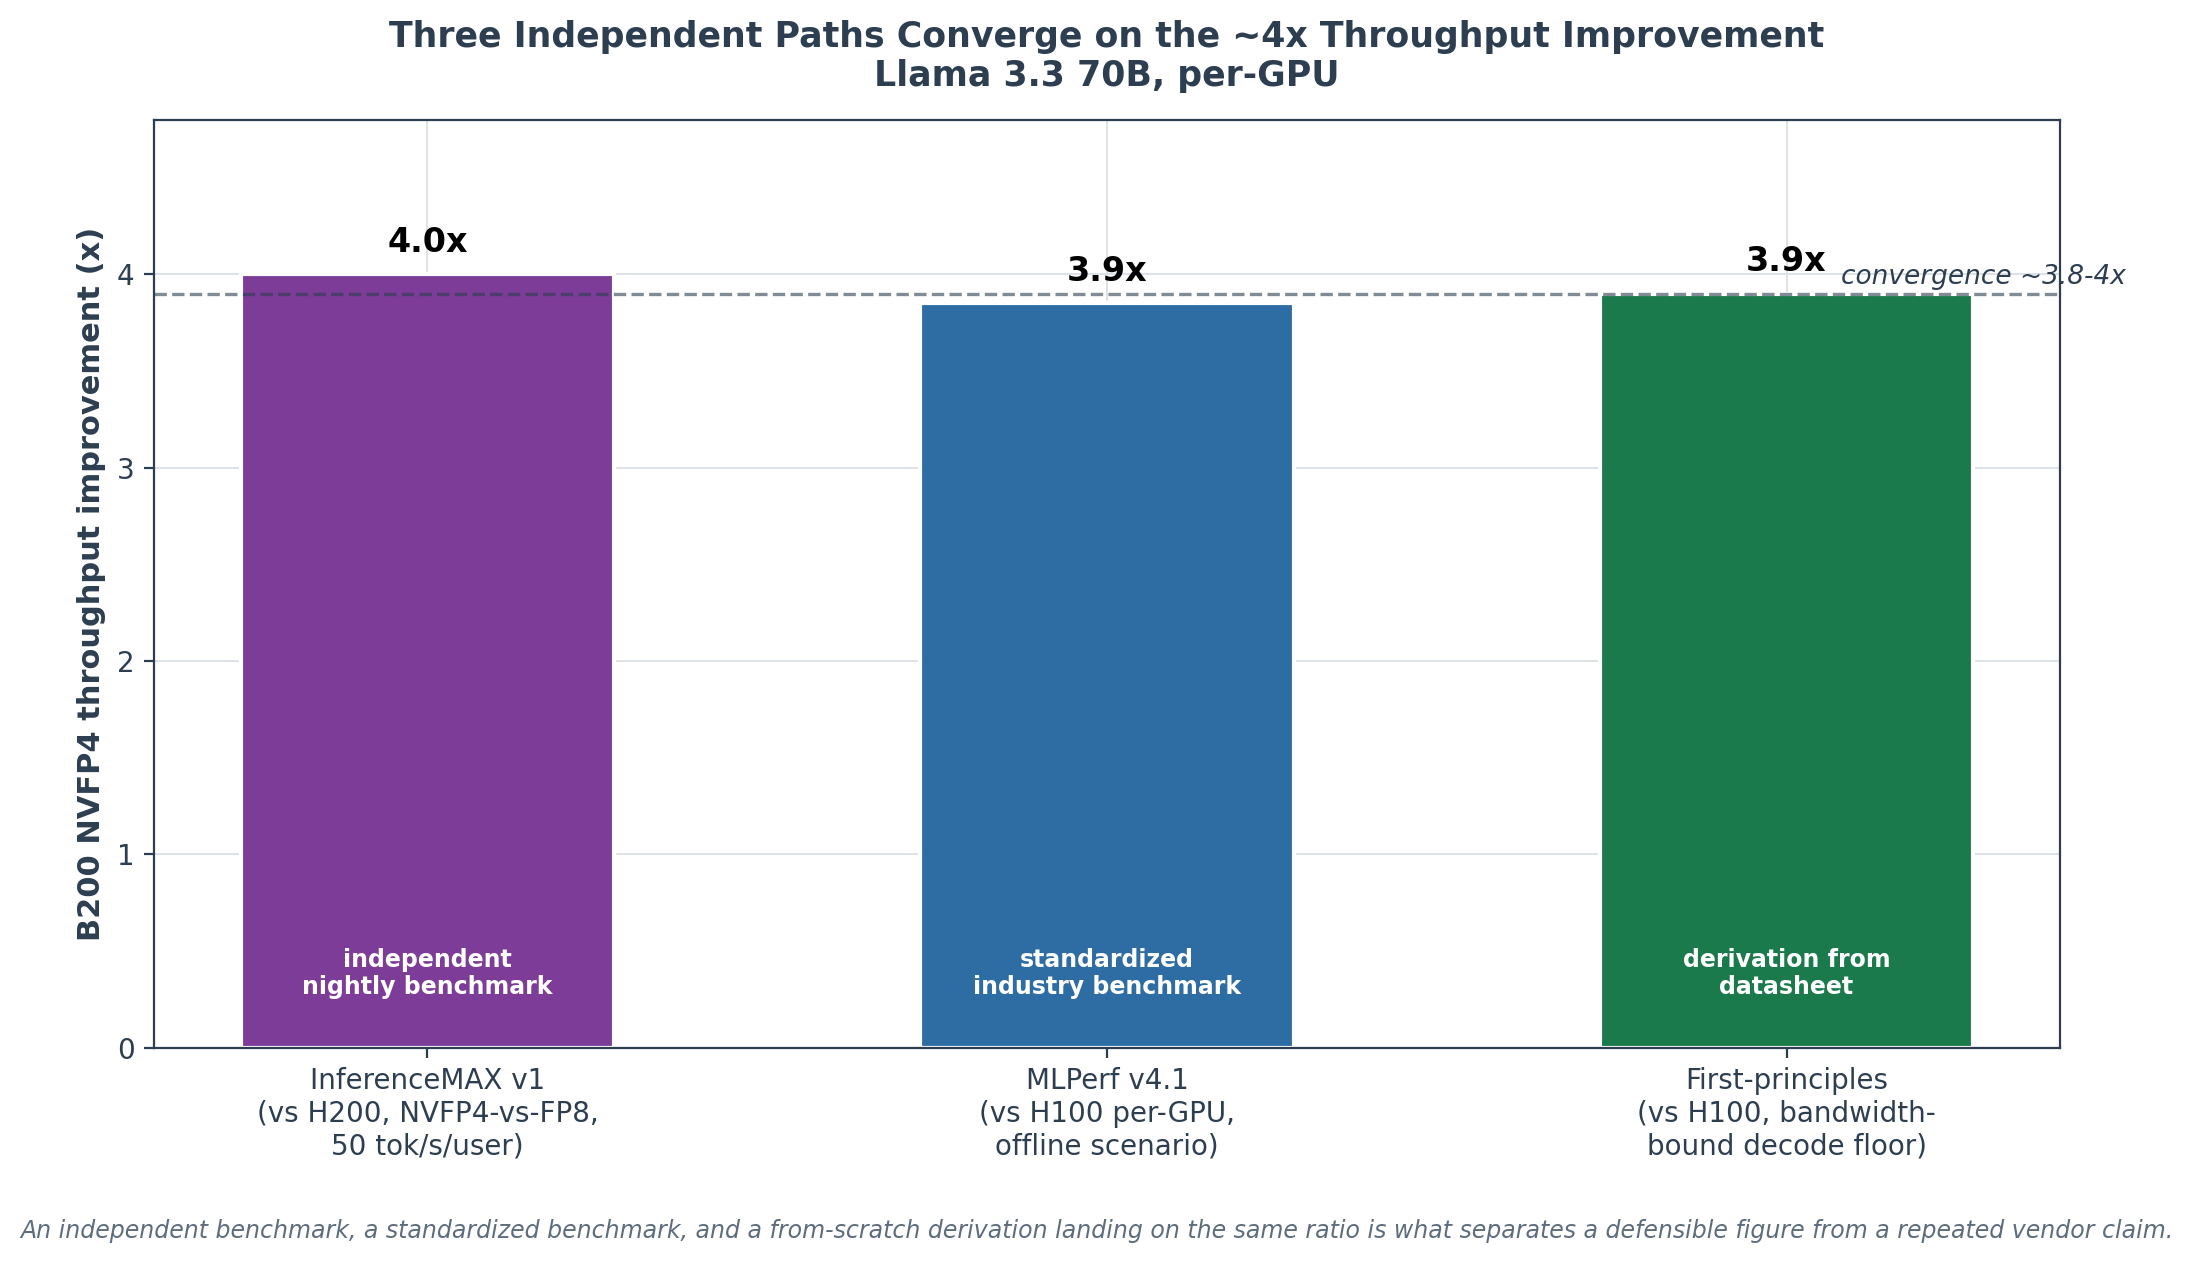
Chart 4. The throughput-improvement figure does not rest on any single source. InferenceMAX v1 (vs H200), MLPerf v4.1 (vs H100 per-GPU), and the first-principles bandwidth derivation (vs H100) all land in the 3.8-4x band.
Part 3, The cost-per-token economics
Two factors determine the cost-per-token improvement: throughput-per-GPU (~4×) and price-per-GPU-hour (varies by cloud, ~2–3×). The product is the cost-per-token ratio.
3.1 The real cost-per-million-tokens math
Using Spheron’s published rates (consistent with the H100 numbers in Issue #1):
Hardware On-demand $/hr Spot $/hr Throughput at 50 tok/s/user Cost / 1M tokens (on-demand) Cost / 1M tokens (spot) H100 SXM5 (FP8) $2.64 $1.66 ~1,500 TPS $0.49 $0.31 H200 SXM5 (FP8) $4.62 $1.92 ~2,500 TPS $0.51 $0.21 B200 HGX (NVFP4) $6.03 $2.12 ~10,000 TPS $0.17 $0.059
All three per-hour rates are Spheron’s published figures as of 22 May 2026 (H100 $2.64/$1.66, H200 $4.62/$1.92, B200 $6.03/$2.12 on-demand/spot). H100 and H200 throughput at 50 tok/s/user is extrapolated from the SemiAnalysis H200-vs-B200 4× ratio combined with the H100-to-H200 1.43× bandwidth scaling; B200 throughput is the InferenceMAX v1 figure.
Note the counterintuitive H200 on-demand row: at $4.62/hr its cost-per-token ($0.51/M) is actually slightly worse than the H100’s ($0.49/M), because the ~43% throughput gain from the higher bandwidth does not fully offset the ~75% price premium.
The H200’s real advantages are its memory capacity (the KV-wall relief in Part 6.1) and its aggressive spot rate ($0.21/M), not its on-demand cost-per-token. This is exactly the kind of inversion that a vendor “1.4× faster inference” headline hides: faster does not mean cheaper-per-token unless the price scales sublinearly with the throughput.
The honest derived improvement, on-demand vs on-demand, is ~2.9× cheaper per million tokens. On spot vs spot, where B200 spot pricing is currently aggressive (Spheron $2.12/hr is lower than H100 on-demand), the improvement reaches ~8× cheaper.
This is materially different from NVIDIA’s “15× lower cost per million tokens” headline. The 15× number is real, but it compares rack-scale GB200 NVL72 air-cooled to H100 HGX air-cooled on MoE workloads (GPT-MoE-1.8T projected throughput, per the NVIDIA datasheet), not single-GPU Llama 3.3 70B. NVIDIA’s announcement post is precise about this: the cost-per-million-tokens claim applies to “AI factory economics” at rack scale, not the single-GPU comparison most readers are actually evaluating.
The 3× to 8× range is what a deployment engineer should plan around. The 15× number is what a CFO will hear from a vendor presentation.
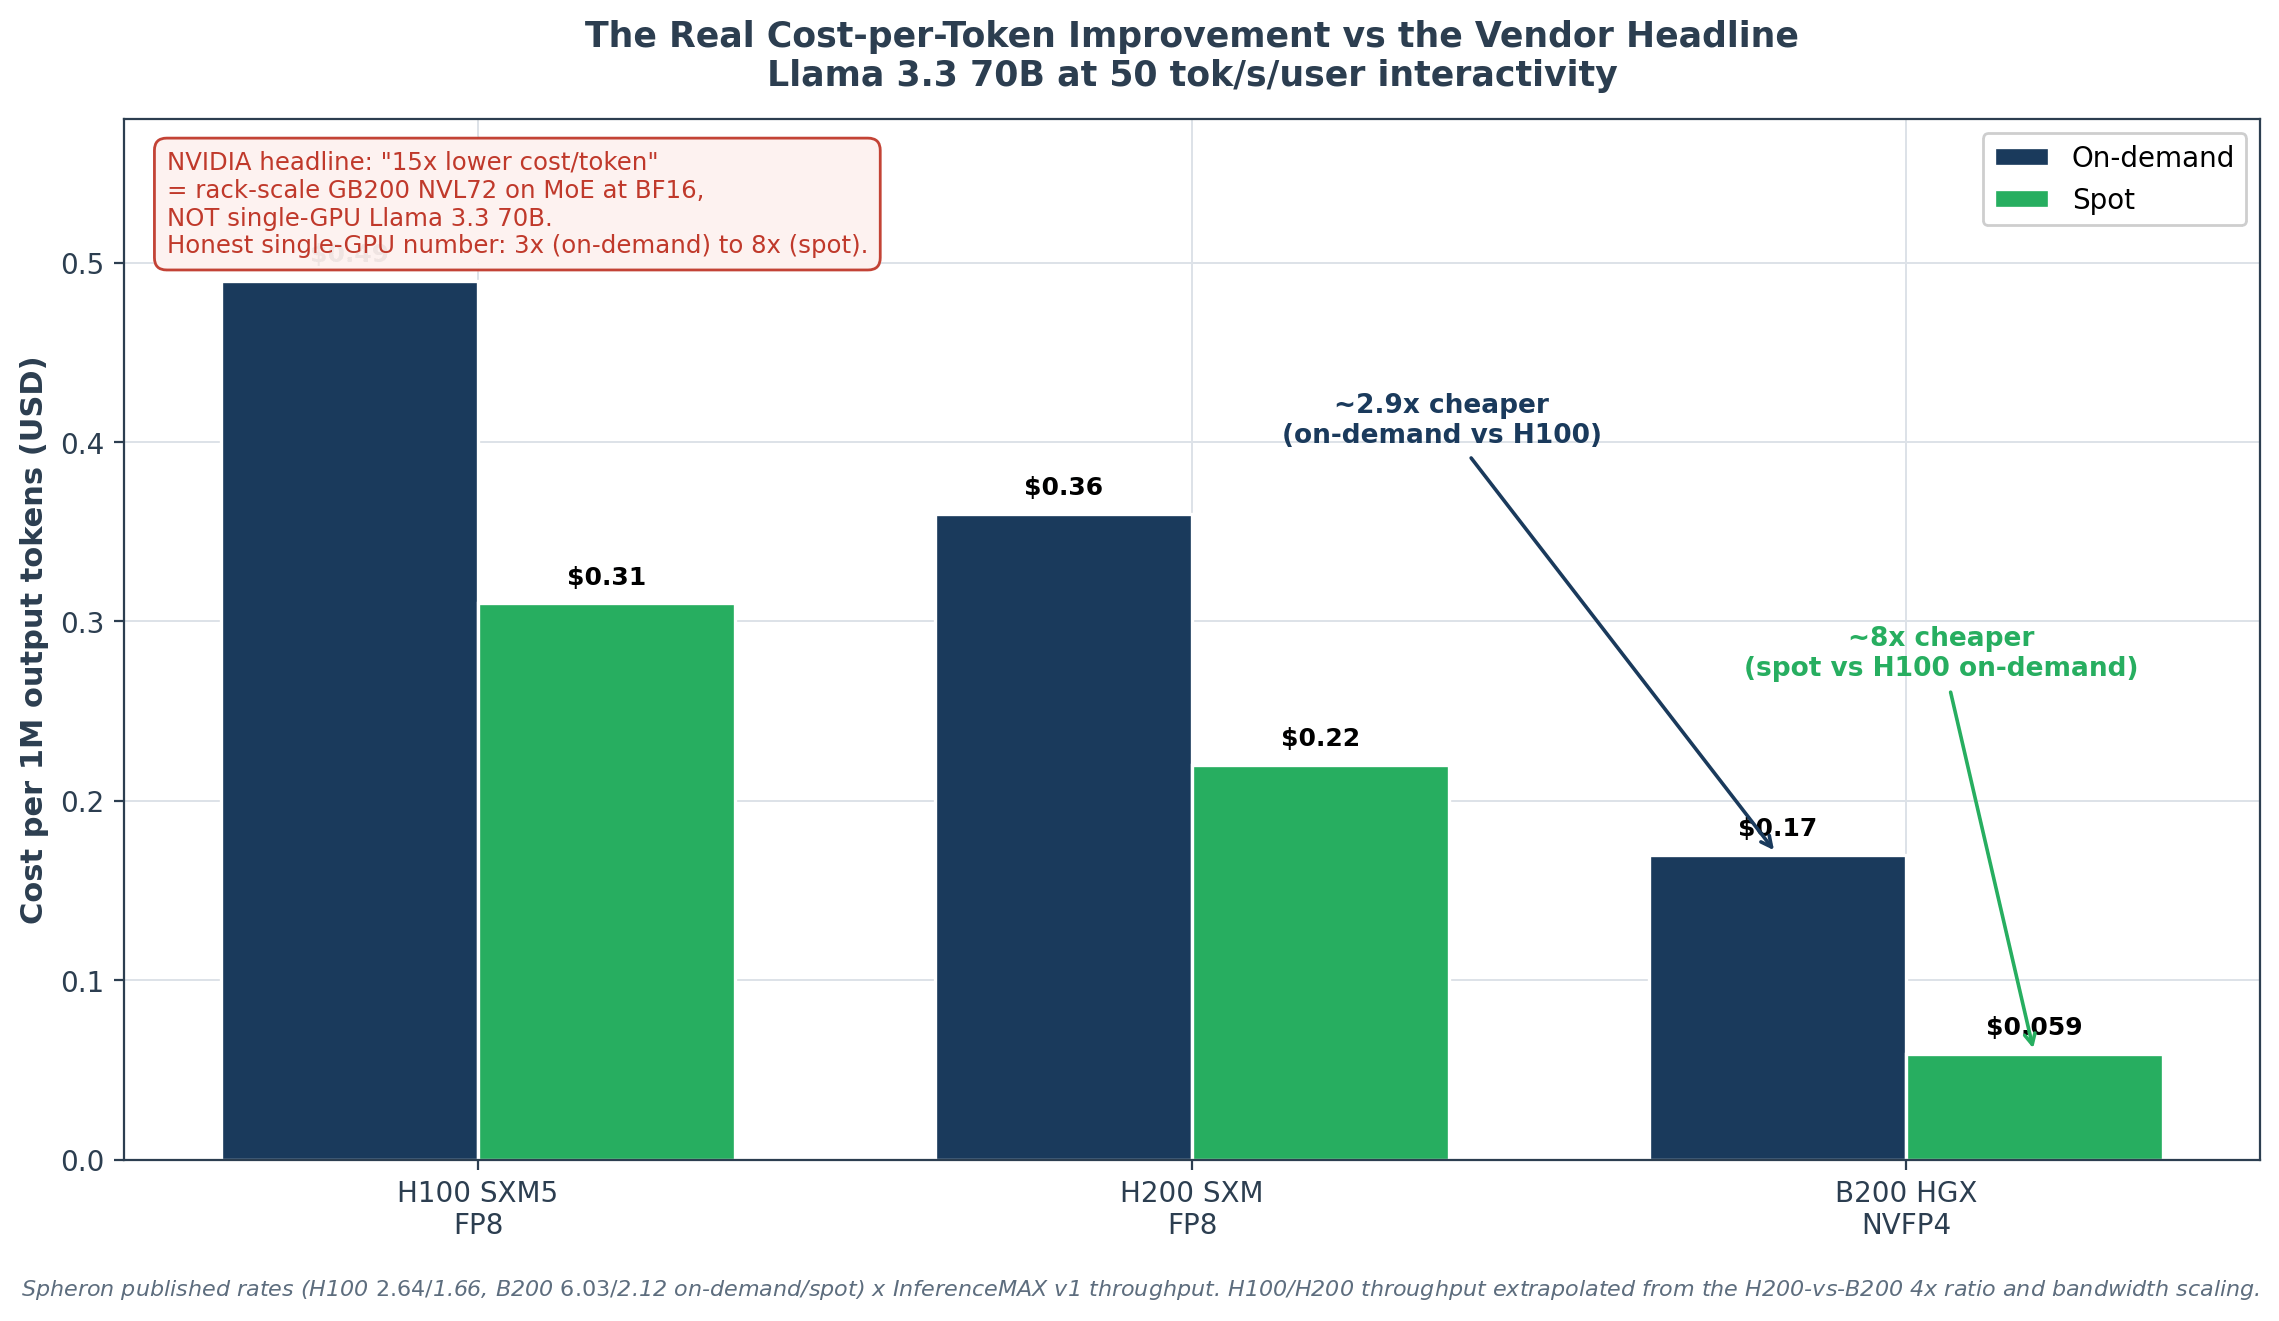
Chart 5. Cost per million output tokens at 50 tok/s/user, from Spheron’s published per-hour rates times InferenceMAX v1 throughput. The honest single-GPU improvement is ~2.9x on-demand and ~8x on spot, well short of NVIDIA’s 15x headline, which is a rack-scale GB200 NVL72 MoE-at-BF16 comparison.
3.2 The migration cost the price-per-token comparison hides
Three categories of migration cost do not appear in the $/M-tokens calculation but determine whether the migration actually saves money.
Infrastructure. B200 HGX runs at 1,000W per GPU vs H100 SXM5’s 700W. GB200 in the NVL72 configuration runs at up to 1,200W per GPU. Rack density falls accordingly, and air-cooling becomes marginal at B200’s power level. Liquid cooling is the production path NVIDIA assumes. Data centers without liquid cooling either run fewer GPUs per rack (reducing the effective $/hr improvement) or deploy in a different facility (capital expenditure not in the per-hour rate). For cloud renters the infrastructure cost is bundled into the per-hour price; for on-premise buyers it is not, and it can easily exceed the GPU hardware cost over a deployment lifetime.
Software maturity. vLLM v0.12.0 is the current Blackwell-ready release as of the Llama 3.3 70B recipe page. NVFP4 support landed first in TensorRT-LLM (full); vLLM has shipped what NVIDIA describes as “early NVFP4 support” with the second-generation Transformer Engine path; SGLang has it on the roadmap. Production deployment in 2026 means accepting a less-mature software stack than Hopper’s, with the kernel and scheduler optimizations of Issue #1 (FlashInfer integration, Triton attention, FA3-vs-FA4 selection, CUDA graph capture) still being landed across the three engines for the new architecture. The Hopper stack benefits from 18 additional months of production hardening that Blackwell will need time to accumulate.
Supply. Hardware order backlogs through mid-2026 mean on-premise B200 purchases compete with hyperscaler allocations. Cloud rental is the practical path, and cloud pricing on B200 is more volatile than on H100. Spheron’s $2.12/hr spot rate is real but not guaranteed across providers or time. The H100 ecosystem is mature enough that a one-year reserved instance commits to a known price; B200 commits are quoted but the secondary-market spread is wider.
3.3 A worked migration example
Take the Issue #1 worked example: a chat product at 50 requests/second peak sustained, 800 input tokens, 400 output tokens. Decode dominates; the output token rate is 50 × 400 = 20,000 tok/s. On H100 FP8 at production interactivity, a single GPU sustained ~1,500 TPS, requiring 14 H100s and costing ~$27,000/month on-demand or ~$17,000/month at spot.
On B200 NVFP4 at the same interactivity, a single GPU sustains ~10,000 TPS, so the same workload needs ~2 B200 GPUs. Cost: $6.03/hr × 2 GPUs × 730 hr/month = ~$8,800/month on-demand, or ~$3,100/month on spot. The on-demand savings vs H100 are roughly $18,000/month; the spot savings are roughly $14,000/month, depending on which side of the comparison gets spot pricing.
Three caveats sharpen the picture. First, the 2-GPU B200 deployment has dramatically more KV headroom (~270 GB aggregate budget vs ~16 GB on 2 H100s), so the same hardware can absorb longer sequences or higher concurrency before scaling out further.
Second, prefill (40,000 in-tok/s required) needs only one B200 GPU’s worth of prefill capacity (~96,000 tok/s ceiling vs the workload’s 40,000), so the deployment is decode-bound everywhere.
Third, the autoscaling math improves: 2 GPUs is a less granular floor than 14, but the per-GPU economics make off-peak headroom less costly. A peak-to-average ratio of 2× on H100 means paying for 28 GPU-hours per peak-hour-equivalent of demand; on B200 it means paying for 4.
The autoscaling discontinuities matter less when each GPU is doing more work.
3.4 What the per-hour rate actually pays for
The single most important fact about inference TCO is structural, and SemiAnalysis states it directly in the InferenceMAX v1 analysis: colocation rent and electricity together are typically less than 20% of total cost of ownership.
The dominant term is the GPU vendor’s gross margin. In SemiAnalysis’s words, some vendors charge “up to 75% gross margins (i.e. a 4× markup over cost of goods sold), while others less than 50% gross margins (i.e. less than 2× cost of goods sold).”
This reframes the migration question. A naive analysis treats the B200’s higher power draw (1,000W vs 700W) as a major cost penalty. It is not: if a B200 delivers 20% fewer tokens per provisioned megawatt than some alternative, that translates to less than 4% of TCO (20% of the under-20% energy share).
The migration economics are dominated by the price you pay for the silicon, which is set by vendor margin and supply, not by the power bill.
This is why the spot-vs-on-demand spread (a ~3× swing in the per-hour rate) dwarfs every efficiency consideration in the cost-per-token math: the per-hour rate is mostly margin, and margin is what moves between spot and on-demand.
The corollary for a buyer: the highest-leverage variable in Blackwell migration economics is procurement, not engineering. Securing B200 capacity at the $2.12/hr spot rate rather than the $6.03/hr on-demand rate is a larger cost-per-token lever than any kernel optimization, any precision choice, or any batching strategy.
The engineering determines the throughput; the contract determines most of the cost.
3.5 Power efficiency: the megawatt view
For power-constrained deployments (the binding constraint for many AI data centers in 2026), throughput per provisioned megawatt is the relevant metric rather than throughput per GPU.
SemiAnalysis InferenceMAX v1 measured this directly, though the published Llama-vs-Blackwell power numbers are for gpt-oss 120B rather than Llama 3.3 70B, so they should be read as a Blackwell-generation indicator rather than a Llama-specific figure.
On gpt-oss 120B FP4, an HGX H100 processes ~900,000 tok/s per all-in provisioned megawatt; an HGX B200 processes ~2.8 million tok/s per megawatt, a ~3× generational power-efficiency gain. At a higher interactivity level of ~180 tok/s/user, the B200 advantage widens to ~7×, because the H100 falls off its efficiency curve faster at high interactivity than the B200 does.
(Provisioned megawatt here means all-in utility power including cooling and electrical-distribution overhead, not just GPU TDP, which is the honest denominator for a data-center operator.)
The ~3× power-efficiency improvement roughly tracks the ~4× throughput improvement, which is expected: the B200’s TDP (1,000W) is ~1.43× the H100’s (700W), and 4× throughput / 1.43× power ≈ 2.8× efficiency.
For a Llama 3.3 70B deployment specifically, the power-efficiency improvement should land in the same 3× range by the same arithmetic, but we flag that the published megawatt figures are gpt-oss numbers and the Llama-specific power measurement is one of the things Issue #3 will report directly.
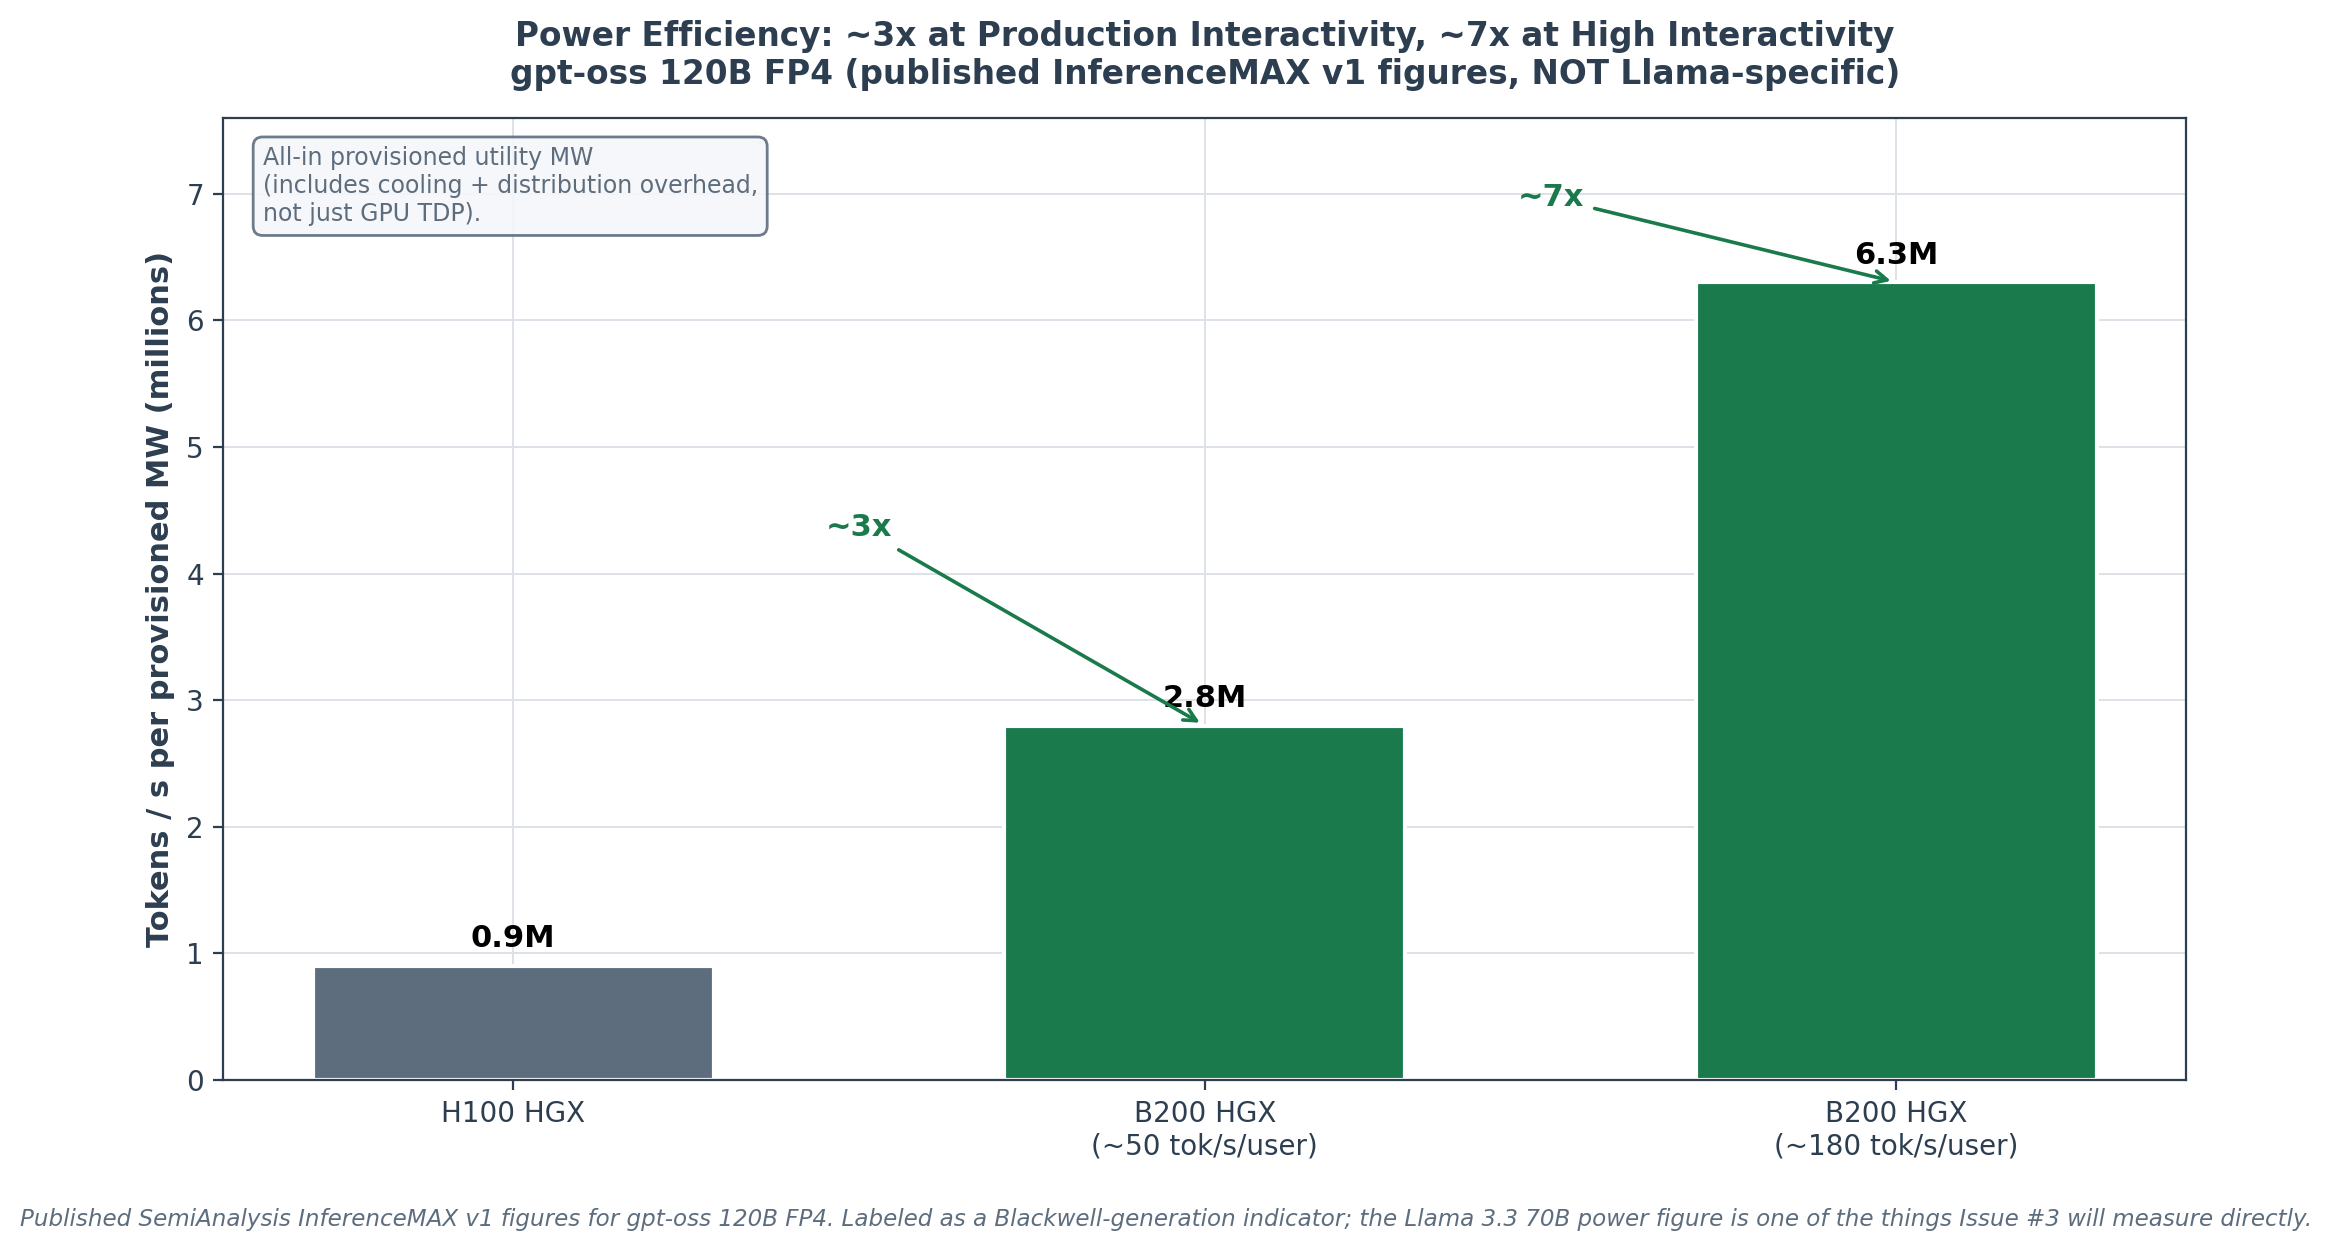
Chart 6. Throughput per provisioned megawatt, H100 vs B200, on gpt-oss 120B FP4 (the published InferenceMAX figures are for gpt-oss, not Llama 3.3 70B, and are shown here as a Blackwell-generation indicator). The ~3x gain at production interactivity widens to ~7x at high interactivity because the H100 falls off its efficiency curve faster.
