
Mastering CUDA and High-Performance Computing, Part VI
A Deep Dive from Compiler Internals to High-Performance Parallel Computing


The Pipeline’s One Promise, and How It Fails
The A100 SM runs at a base clock of approximately 765 MHz, boost to ~1410 MHz. At boost, one clock cycle is ~0.71 nanoseconds. The SM has four SMSPs.
Each SMSP has four warp schedulers (confirmed in NVIDIA’s Ampere whitepaper and independently via microbenchmarks by Jia et al. and the work of Markidis, Larsson et al.).
Each scheduler attempts to issue one instruction per cycle to one eligible warp.
At full throughput (all four schedulers in all four SMSPs issuing every cycle) a single A100 SM issues 16 instructions per cycle.
Across 108 SMs at 1410 MHz, peak issue rate is roughly 2.4 trillion instructions per second. This is the theoretical ceiling. You will never reach it. The question is why, and by how much.
An instruction issues in a given cycle when three conditions are simultaneously true:
The warp is eligible: it has been selected by the round-robin/priority scheduler, it is not stalled on a scoreboard dependency, and it has not exceeded the warp’s instruction buffer depth.
The execution unit is available: the target pipe (FMA, SFU, MIO, LSU...) has a free slot.
All operands are ready: every source register’s scoreboard bit has been cleared by its producing instruction.
When any of these three conditions fails, the scheduler increments a stall counter and moves to another warp.
The beauty of the GPU microarchitecture, and the central insight of GPU optimization, is that condition (3) failing for warp A doesn’t stall the SM; it just causes the scheduler to attempt warp B instead.
The SM stalls only when no warp satisfies all three conditions simultaneously. That’s the failure mode we are trying to prevent.
ncu --metrics l1tex__t_sectors_pipe_lsu_mem_global_op_ld.sum is how you measure condition (3) failures for memory. smsp__warp_issue_stalled_* counters measure them by category.
We will use both throughout.
What lives inside one SMSP
Before discussing stalls, you need an accurate map of what execution units exist and what their throughput and latency look like.
Much of the confusion in GPU optimization literature stems from people using “the FP32 pipe” as a monolith when it is not.
One Ampere SMSP contains, per NVIDIA’s Ampere Architecture whitepaper and corroborating microbenchmark work:
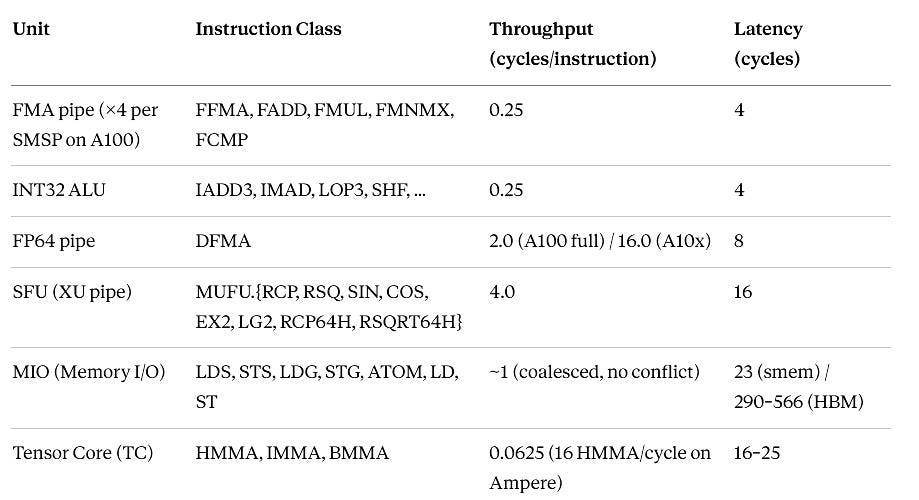
A few notes on the accuracy of this table:
The FMA latency of 4 cycles is confirmed by the CUDA C Programming Guide and by numerous independent microbenchmarks.
It is not 1 cycle. It is not 2 cycles. It is 4, and every serial dependency chain in your kernel pays it in full.
The SFU latency of 16 cycles is confirmed by microbenchmarks. Throughput of 4 cycles/instruction means one MUFU occupies the single SFU for 4 cycles; other warps’ MUFU instructions queue behind it.
Since there is only one SFU per SMSP and the SMSP has 16 warps maximum, a warp issuing a MUFU must wait for the SFU to become free if another warp issued one within the last 4 cycles.
The FP64 throughput asymmetry is critical for A100 versus A30/A10 hardware: the A100 has full-rate FP64 (2 cycles per DFMA per SMSP), while the A10 has 1/16th the FP64 throughput (DFMA at 32 cycles per instruction).
Running FP64 code on an A10 is not slower: it is catastrophically slower. Verify your hardware before benchmarking.
Shared memory load latency of 23 cycles is confirmed by microbenchmarks (Luitjens 2011, Volkov 2016, and more recently by Yan et al. in their SM scheduling simulator).
The official CUDA documentation says “~20 cycles” without precision; 23 cycles is the empirically correct number for Ampere under normal bank-conflict-free access.
With 4-way bank conflicts the effective latency compounds because the MIO pipe is occupied for additional cycles while the bank serialization completes.
The scoreboards in detail
Each SMSP has two scoreboards, as described in Part V. Understanding their interaction with execution units is worth revisiting with more precision:
Short scoreboard: covers arithmetic results from the FMA pipe, INT32 ALU, and SFU. Latency tracked: 4 cycles (FMA/INT32) and 16 cycles (SFU). The scoreboard has one bit per register per warp.
When an FFMA issues with destination R4, bit R4 for that warp is set in the short scoreboard. It is cleared 4 cycles later (for FMA results) by the pipeline’s bypass network.
An instruction in another warp that reads R4 of the issuing warp is unaffected: scoreboards are per-warp, not global.
Long scoreboard: covers memory results: any instruction that issues to the MIO unit (loads from global/shared/local memory, atomic operations).
The long scoreboard bit is set when the load issues and is not cleared until the data physically arrives and is written to the register file.
For an HBM access this can be 400+ cycles. The SMSP does not know in advance how long an HBM access will take (it depends on DRAM row buffer state, competing traffic, etc.); it just waits for the completion signal from the memory system.
An important subtlety: cp.async instructions do not set the long scoreboard. This is the mechanism by which they achieve asynchrony.
The register file is not involved, so no register’s bit is marked pending.
The SMSP issues the cp.async, the copy engine takes it, and the SMSP is immediately free to issue the next instruction for that warp.
We will return to the exact implications of this in future posts.
The SFU, quantified completely
The Special Function Unit executes MUFU instructions. Let’s be more precise than “the SFU is slow.”
On Ampere, one SMSP has one SFU. The SFU pipeline is 4 stages deep; this is why it has a 4-cycle throughput: one new instruction can enter the pipeline every 4 cycles (this is the initiation interval, II), and the result is available 16 cycles after issue (this is the latency, L = 4 × II).
This is a reasonable structural design for a unit that computes hardware approximations to transcendentals: the underlying Newton-Raphson iterations take multiple stages.
The key distinction: throughput (4 cycles/instruction) limits how often you can issue MUFU instructions from the same SMSP.
Latency (16 cycles) limits how soon a downstream instruction can use the MUFU result.
Both matter; they fail you in different scenarios.
What MUFU opcodes actually compute
MUFU is not one instruction. It is one instruction format with an operation selector.
The compiler maps standard C math functions to MUFU as follows.
This mapping is important because the additional FFMA instructions required for argument scaling and result scaling come for free (they don’t touch the SFU), but they do consume FP32 pipe cycles:
expf(x) → __expf(x) (with -use_fast_math):
// Argument reduction: convert from base-e to base-2
// exp(x) = 2^(x * log2(e)) = 2^(x * 1.44269504...)
FMUL   R1, R0, 1.44269502f          ; x * log2(e), FP32 pipe, 0.25 cycles throughput
MUFU.EX2  R2, R1                    ; 2^(x*log2e), SFU, 4 cycles throughput
expf(x) (IEEE-compliant, without fast-math):
// Range check and reduction (compiler-generated, varies)
FMNMX  R1, R0, 88.722839f, ...      ; clamp to avoid overflow
FFMA   R2, R1, 1.44269502f, ...     ; argument reduction with correction term
MUFU.EX2  R3, R2                    ; core computation
FMUL   R4, R3, ...                  ; reconstruction (potentially)
// Plus additional corrections for subnormals, NaN, INF
The IEEE-compliant version may issue conditional branches for edge cases. When your kernel has inputs that might be NaN, INF, or very large/small, the compiler generates defensive code.
__expf() removes these guards entirely: it is undefined behavior for inputs outside [−87.3, 88.7] (the approximate FP32 range of exp before overflow/underflow).
If you know your inputs are bounded, and in softmax after max-subtraction they are, since all values are ≤ 0, __expf() is always the correct choice.
tanhf(x) (any mode):
tanh has no single MUFU opcode. The compiler implements it using the identity: tanh(x) = 1 - 2/(exp(2x)+1).
The resulting SASS (approximately, varies by compiler version) includes:
FMUL   R1, R0, 2.0f                 ; 2x
FMUL   R2, R1, 1.44269502f          ; 2x * log2(e)
MUFU.EX2  R3, R2                    ; 2^(2x * log2e) = exp(2x)
FADD   R4, R3, 1.0f                 ; exp(2x) + 1
MUFU.RCP  R5, R4                    ; 1/(exp(2x)+1)
FMUL   R6, R5, 2.0f                 ; 2/(exp(2x)+1)
FADD   R7, -R6, 1.0f                ; 1 - 2/(exp(2x)+1) = tanh(x)
That’s two MUFU instructions (one EX2, one RCP) per tanhf call; 8 cycles of SFU pipe occupied per call in throughput terms.
For GELU, which uses tanhf internally (the fast approximation 0.5x(1+tanh(√(2/π)(x+0.044715x³)))), you have additional FFMAs on top.
GELU activation in a fused kernel is expensive in SFU terms, which is one motivation for the simpler SiLU activation (x * σ(x) = x / (1 + exp(-x))): it requires one MUFU.EX2 plus a few FMAs versus two MUFUs for tanh.
Throughput model for an SFU-bottlenecked loop
Suppose your kernel’s inner loop body, after compilation, contains:
1× MUFU.EX2 (4-cycle throughput, SFU pipe)
3× FFMA (0.25-cycle throughput each, FMA pipe)
2× FADD (0.25-cycle throughput each, FMA pipe)
1× LDS (shared memory load, ~1-cycle throughput assuming no bank conflict)
Total FMA pipe demand: 5 × 0.25 = 1.25 cycles
Total SFU pipe demand: 1 × 4.0 = 4.0 cycles
Total MIO demand: 1 × ~1.0 = ~1.0 cycles
The SFU is the bottleneck: the loop cannot issue faster than 4.0 cycles per iteration.
The FMA pipe is occupied 1.25/4.0 = 31% of the time. The remaining 69% of FMA pipe capacity is wasted, waiting for the SFU to finish so the next iteration can begin.
You can fill this gap in two ways: more ILP within the loop (unroll and issue multiple independent MUFU calls, keeping both the SFU and FMA pipe busier) or replace MUFU with FMA-pipe arithmetic.
The first approach doesn’t change the SFU ceiling; it just makes better use of the FMA pipe in parallel.
The second moves the ceiling.
Polynomial exp replacement: the real implementation
The “4th order polynomial” approach described in the previous version of this article is plausible but underspecified.
Here is a properly validated implementation using a piecewise approach compatible with softmax use cases:
// Fast exp2f approximation — pure FP32, no SFU
// Maps to ~6 FFMAs in SASS
// Valid for x ∈ [-126, 127] (FP32 normal range for 2^x)
// Error: < 2^-23 relative for x ∈ [-16, 16] (sufficient for softmax)
__device__ __forceinline__ float fast_exp2f_fma(float x) {
    // Decompose x = n + f where n is integer, f ∈ [-0.5, 0.5]
    float n = __float2int_rn(x);      // round to nearest int — FMUL-based
    float f = x - n;                  // fractional part

    // Minimax polynomial for 2^f over [-0.5, 0.5]
    // Coefficients: Sollya minimax degree-4 in Horner form
    // 2^f ≈ 1 + f*(0.693147 + f*(0.240227 + f*(0.055504 + f*0.009618)))
    float p = 0.009618f;
    p = fmaf(p, f, 0.055504f);
    p = fmaf(p, f, 0.240227f);
    p = fmaf(p, f, 0.693147f);
    p = fmaf(p, f, 1.0f);             // 2^f approximation

    // Reconstruct 2^x = 2^n * 2^f via integer exponent manipulation
    // Pack n into FP32 exponent bits: (int)(n + 127) << 23
    int e = __float2int_rn(n) + 127;
    float scale = __int_as_float(e << 23); // exact power of 2, no error

    return p * scale;
}

// For expf(x): expf(x) = exp2f(x * log2(e))
__device__ __forceinline__ float fast_expf_fma(float x) {
    return fast_exp2f_fma(x * 1.4426950408889634f);
}
SASS output for fast_expf_fma: approximately 8 FFMAs, 1 F2I, 1 I2F, 1 integer SHL, 1 FMUL. No MUFU.
Throughput: ~2–2.5 cycles per call on the FMA pipe. Versus MUFU.EX2 at 4 cycles: a genuine 1.6–2× throughput improvement for softmax inner loops on Ampere.
The catch: verify SASS output yourself. The compiler has latitude with __int_as_float and __float2int_rn.
Confirm with nvdisasm that no MUFU instructions appear in the compiled output.
Measuring SFU utilization precisely
The two relevant Nsight Compute metrics:
smsp__pipe_fma_cycles_active.avg.pct_of_peak_sustained_active
smsp__pipe_xu_cycles_active.avg.pct_of_peak_sustained_active
On an SFU-bottlenecked kernel, xu (XU = execution unit, NVIDIA’s internal name for the SFU pipe) will be near 100% and fma will be proportionally lower.
The ratio xu_cycles / fma_cycles tells you the SFU/FMA throughput imbalance directly.
Also useful: smsp__average_warp_latency_per_inst_executed.ratio; if this is high while xu_cycles_active is also high, the warp latency is being driven by MUFU’s 16-cycle result latency, not just its 4-cycle throughput.
Both cost you, via different mechanisms.
The L0 Instruction cache
Each SMSP on Ampere has a dedicated 32 KB L0 instruction cache (also referred to as the I-cache in some microarchitecture literature).
This is physically separate from the unified L1 data/shared memory: it is not carved from the 192 KB L1 pool.
The L0 is private to each SMSP; four SMSPs per SM means four independent L0 caches per SM.
Instructions on Ampere are 128 bits (16 bytes) wide. The L0 holds 32 KB / 16 B = 2048 instructions.
A typical kernel loop body of 100–300 instructions fits comfortably; the L0 warms up on the first iteration and subsequent fetches are essentially free (one cycle or less).
The exception: kernels generated from heavily templated C++ code (think Thrust or hand-unrolled matrix multiplication with large tile sizes) can have loop bodies exceeding 500–1000 instructions.
A kernel that fully unrolls a 256-wide loop body with 8 FMAs per iteration emits 2048 instructions for that loop; exactly filling the L0 and leaving nothing for the rest of the kernel.
Add one more instruction and you start thrashing.
When the L0 misses, the SMSP must fetch from L1 instruction cache (shared with data traffic, with associated latency) or, worse, from L2.
L1 instruction fetch latency is approximately 20–30 cycles. The miss is captured by:
smsp__pcsamp_warps_issue_stalled_imc_miss.sumValues above 2% indicate a structural code-size problem. Values above 10% are severe.
There is no runtime mechanism to manage L0 occupancy. The only intervention is compile-time code size reduction:
Replace
#pragma unroll Nwith smaller N or#pragma unroll 1for large NMark non-critical helper functions with
__noinline__Split large kernels into kernel launch sequences (costs launch overhead; evaluate the trade-off)
Use
--maxrregcountto limit register count, which sometimes causes the compiler to generate shorter instruction sequences
Instruction decode bandwidth
Decoded instructions are held in per-warp instruction buffers before issue.
On Ampere, these buffers are approximately 2 entries deep per warp (this is not officially documented; it is reverse-engineered from microbenchmarks.
Specifically, from observing that back-to-back dependent instructions with 1-cycle-latency arithmetic operations still issue without stall, implying at least 2-deep pre-decoding).
The decoder can process approximately 1 instruction per cycle per SMSP (across all warps).
This exceeds the issue rate for any single warp (maximum 1 instruction every 4 cycles for a compute-bound warp at peak), so the decoder runs ahead and the per-warp instruction buffer is almost always populated.
The pathological case: a kernel at very high occupancy (32 warps per SMSP, the A100 maximum) with a simple loop body of 3 instructions (say, a vectorized element-wise operation: LDG.128, FFMA.x4, STG.128).
All 32 warps are eligible every cycle. The decoder must keep all 32 instruction buffers populated.
At 1 decode per cycle and 32 warps each needing fresh instructions, the decoder is stretched.
If the instruction stream is not in L0 (forcing L1 fetch at 20+ cycle latency), the buffers drain and the schedulers stall even though 32 eligible warps exist.
This is rare but real. It manifests as a high smsp__pcsamp_warps_issue_stalled_imc_miss combined with near-100% occupancy;
confusing until you understand that 32 resident warps generates 32× the instruction fetch pressure of 1 warp.
Predicated execution
Each thread on Ampere has 7 predicate registers (P0 through P6).
These are separate from the 255 available scalar registers (R0–R254, with R255 reserved as the zero register).
Predicate registers are 1-bit values set by comparison instructions:
// Source: if (a > b) { ... }
FSETP.GT.AND P0, PT, R0, R1, PT   ; set P0 = (R0 > R1), unconditional (PT = true predicate)
FSETP.GT.AND P0, PT, R0, R1, PT reads as: “set predicate P0 to (R0 > R1) AND PT, and set the complement predicate (implicit) to the inverse, and all of this unconditionally (final PT).”
The AND/OR suffix specifies the combining mode for nested predicate logic.
This instruction issues on the FP32 pipe, costs 4-cycle latency, and produces a predicate bit, not a register value.
An instruction with a predicate prefix:
@P0    FFMA  R3, R1, R2, R3    ; execute FFMA only if P0 is true
@!P0   FFMA  R5, R1, R2, R5   ; execute FFMA only if P0 is false
The semantics at the hardware level: all lanes in the warp issue the instruction. The instruction traverses the pipeline.
When the result write-back occurs, it is gated by the predicate: lanes where the predicate is true write their result; lanes where it is false suppress the write-back.
No branch. No warp divergence. No reconvergence stack manipulation.
Consequence: predicated instructions consume throughput proportional to the total number of instructions, not proportional to the number of active lanes.
A 32-thread warp where 16 threads have P0=true and 16 have P0=false, executing @P0 FFMA R3, R1, R2, R3, consumes exactly the same FFMA pipe resources as all 32 threads having P0=true.
The 16 non-writing threads waste their execution slots.
This is the precise definition of “predicated execution trades throughput for divergence avoidance.”
The compiler’s branch/predicate decision heuristic
The CUDA compiler (nvcc, using the LLVM PTX backend) uses a cost model to decide between a BRA (branch) and predication. The model is approximately:
Predication is chosen when:
The combined instruction count of both branch arms is ≤ ~8–12 instructions total
OR the divergence probability is estimated to be high (many warps will have mixed predicate values)
OR the branch target is not cache-resident (branch prediction overhead is higher)
Branch is chosen when:
One arm is long (> ~6 instructions) and the other is short
The compiler can estimate that the majority of warps will take one branch uniformly
The branch condition is amenable to warp-uniform evaluation (all threads agree)
The threshold is not a hard constant: it depends on the compiler version, optimization level, and the surrounding code structure.
The reliable way to check what the compiler chose is to inspect SASS:
# Disassemble a compiled kernel to SASS
nvdisasm --print-instruction-types mykernel.cubin | grep -E "BRA|@P[0-9]"
Or, within Nsight Compute:
Source tab → enable “Source Counters” → switch to “SASS” view → look for @P0 prefixes versus BRA instructions in the hot loop.
When to override the compiler’s choice
The compiler is generally right. The cases where it is wrong:
Case 1: Long rare branch incorrectly predicated. If your hot loop has a condition triggered 1% of the time (e.g., an overflow check, a boundary condition), and the expensive handler is 15 instructions, the compiler might still predicate if the loop body is otherwise short and the combined instruction count falls under the threshold.
But 15 instructions × 32 threads × 1% frequency = the equivalent of 0.15 × 32 = ~5 instructions of wasted throughput per loop iteration, running at full throughput instead of 1% of it. Branch would cost nothing for the 99% case.
Fix: restructure the code to make the “expensive” path obviously large and separated: e.g., a function call rather than inlined code, which the compiler treats as a definite branch site.
Case 2: Warp-uniform condition incorrectly compiled as branch. If every thread in a warp evaluates the same condition (e.g., based on blockIdx.x or a value loaded from constant memory that all threads share), the warp takes the branch uniformly and pays zero divergence cost.
The compiler sometimes generates a branch here and sometimes predicates. When the branch is warp-uniform and the body is long, you want a branch (all threads skip the long body together); predication would execute the long body for all threads on every iteration.
You can encourage warp-uniform branch treatment by computing the predicate with __all_sync(__activemask(), condition) when you know it’s warp-uniform — this makes the intent explicit.
Conclusion
Predication is not a free lunch, and it is not free branching.
It is a specific trade: you pay throughput for all threads to avoid the divergence tax of splitting and reconverging a warp.
That trade is profitable when the branch body is short and divergence is likely.
It is catastrophically unprofitable when the branch body is long and most threads would have skipped it entirely.
The compiler’s heuristic gets this right most of the time, because most conditionals in well-written kernels are short.
The cases where it fails: a rare overflow handler that gets predicated, a warp-uniform load flag that gets branched, are invisible at the source level and only show up as unexplained throughput loss in the profiler.
The smsp__warp_issue_stalled_not_selected stall counter rising without a corresponding increase in occupancy is one signal; anomalously low FMA pipe utilization relative to the instruction count is another.
The discipline is the same as everywhere else in this series: don’t assume the compiler made the optimal choice.
Inspect the SASS, verify the @P prefixes are where you expect them and absent where you don’t, and use __all_sync to make warp-uniform conditions structurally explicit rather than relying on the compiler to infer them.
A predicate register costs nothing. A 15-instruction predicated block running at full throughput for 99% of warps that didn’t need it costs exactly as much as running it unconditionally; which is, in fact, what you did.