


A very short version
NVIDIA’s data center revenue more than doubled in a year, to $89.0 billion a quarter. The company now sells whole racks, supplies reference designs for the buildings around them, and increasingly backs the financing as well.
The Vera Rubin rack started shipping in August, and the version of its product page updated on September 11 lists lower memory and NVLink bandwidth than the August version did, without explanation, which moves the batch size at which these machines stop being limited by memory.
Power, cooling and memory are the constraints that matter now, and the balance sheet shows it: $279 billion of supply commitments, mostly memory, up to $105 billion of guarantees behind one Ohio campus, and operating cash flow that fell to 40% of net income, partly because some customers were given longer to pay.
The real introduction
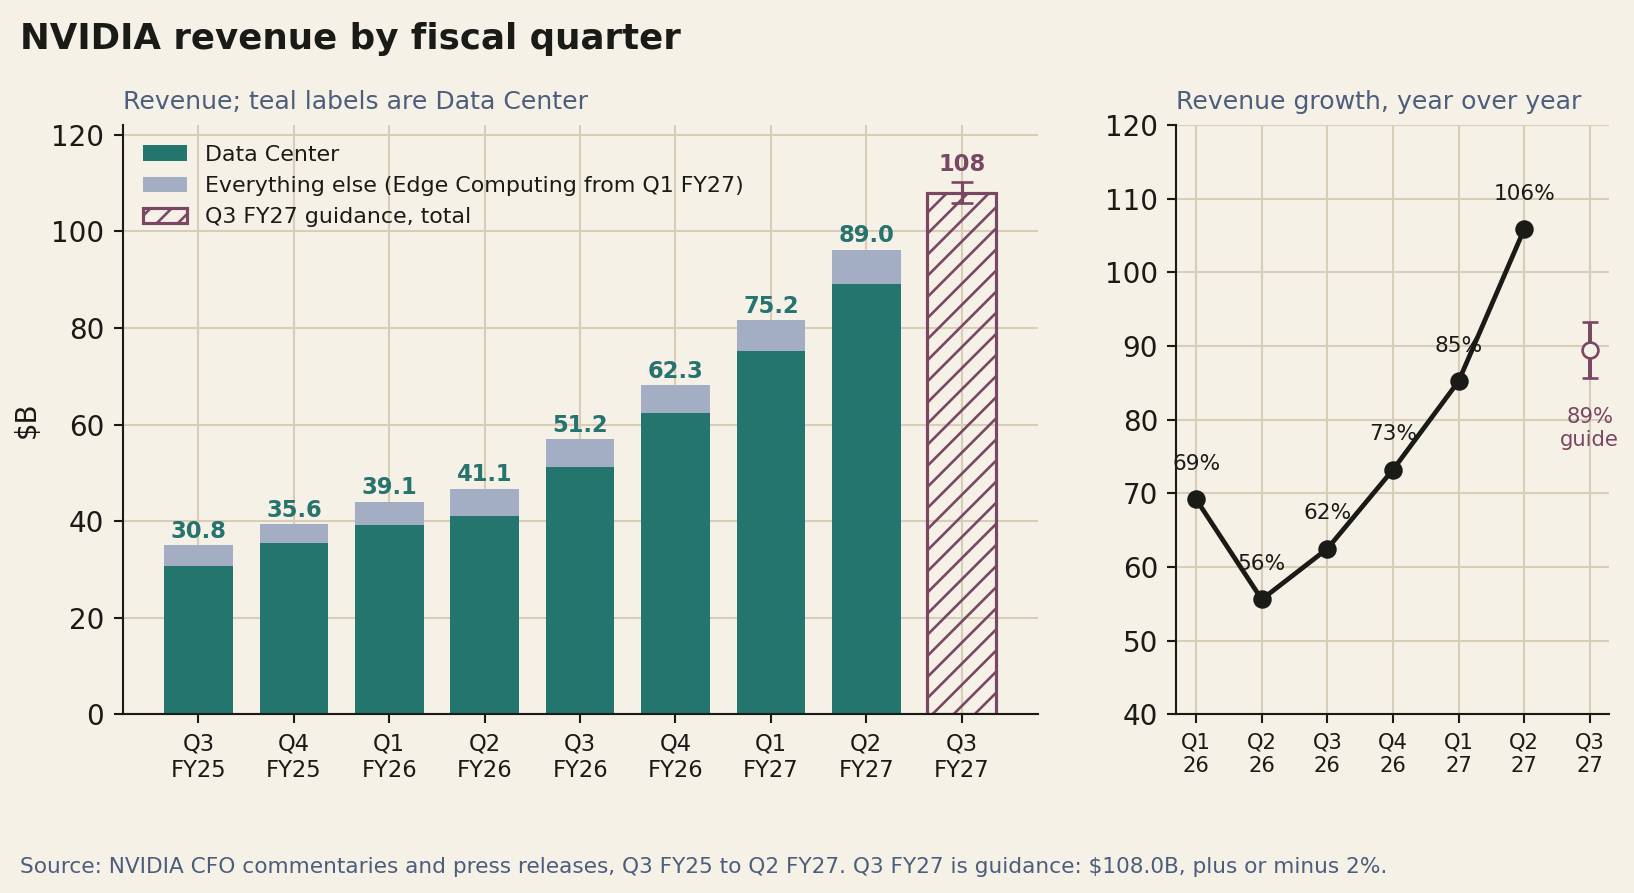
We’ve alredy explored the fact that NVIDIA’s second quarter of fiscal 2027 closed on July 26, 2026, and the company reported it on August 26. On it we saw that revenue was $96.2 billion, up 106% from a year earlier, and $89.0 billion of it came from the data center.
But as many of you know, those are just the mere “headline numbers”. The part of the filing that says more about where the data center business is going towards sits further down the CFO commentary, in a section about commitments and guarantees.
That small section lists $279 billion of supply and capacity commitments, up from $119 billion just three months earlier, an increase NVIDIA itself attributes mainly to memory.
It lists $36 billion under agreements with AI clouds, a structure the CFO described on the call as a take-or-pay commitment on part of a facility’s capacity in exchange for a share of its revenue, and $20 billion of data center leases that NVIDIA signed and expects to reassign to third parties.
What sounds obvious is that neither of those two lines appears in the first quarter’s commentary. And it lists guarantees with a maximum gross exposure of $108.5 billion, of which $105 billion backs the land, power and shell for 4.25 gigawatts at a campus in Ohio that OpenAI will lease for 20 years.
Read next to the product news since the end of May, those tables describe a company whose unit of sale has moved from the chip to the rack and now to the gigawatt. At that scale the scarce inputs are memory, power, buildings and credit, and NVIDIA is now putting its own balance sheet behind all four.
The quarter
In the filing’s own terms, second quarter revenue grew 18% sequentially, and Data Center grew 18% sequentially and 117% year over year. That put Data Center at 92.5% of the total, against 92.2% in the first quarter.
Everything else now sits in a platform called Edge Computing: $7.2 billion in the quarter, up 13% sequentially and 27% from a year ago. NVIDIA adopted this two-platform framework in the first quarter.
Data Center is split into Hyperscale and ACIE, and Edge Computing covers PCs, game consoles, workstations, AI-RAN base stations, robotics and automotive. GAAP gross margin was 75.0%, GAAP operating income $63.7 billion and GAAP net income $59.7 billion, which includes $7.8 billion of pre-tax net gains on equity securities.
The CFO pointed out on the call that growth accelerated for the fourth quarter in a row. Year over year, revenue grew 56% in the second quarter of fiscal 2026, then 62%, 73%, 85% and now 106%. The third quarter guide of $108.0 billion, plus or minus 2%, means 89% growth at the midpoint and 93% at the top of the range, so extending the streak would take a result above $117.3 billion, 8.7% over the midpoint.
NVIDIA beat its own midpoint by 4.6% in the first quarter and by 5.7% in the second. The comparison base is also harder: revenue in the third quarter of fiscal 2026 was 22% above the quarter before it.
For fiscal 2028, which roughly corresponds to calendar 2027, NVIDIA gave a preliminary outlook of about 70% revenue growth and described it as supply-constrained. Huang said the company had never guided a full year ahead before.
The CFO said customer forecasts point to growth doubling, and that supply should remain a bottleneck at least through the end of fiscal 2028.
The third quarter outlook assumes no Data Center compute revenue from China. Shipments of Hopper products to China were below 1% of Data Center revenue in the quarter; in the first quarter of fiscal 2026, before the license requirement, NVIDIA had sold $4.6 billion of H20.
Who is buying
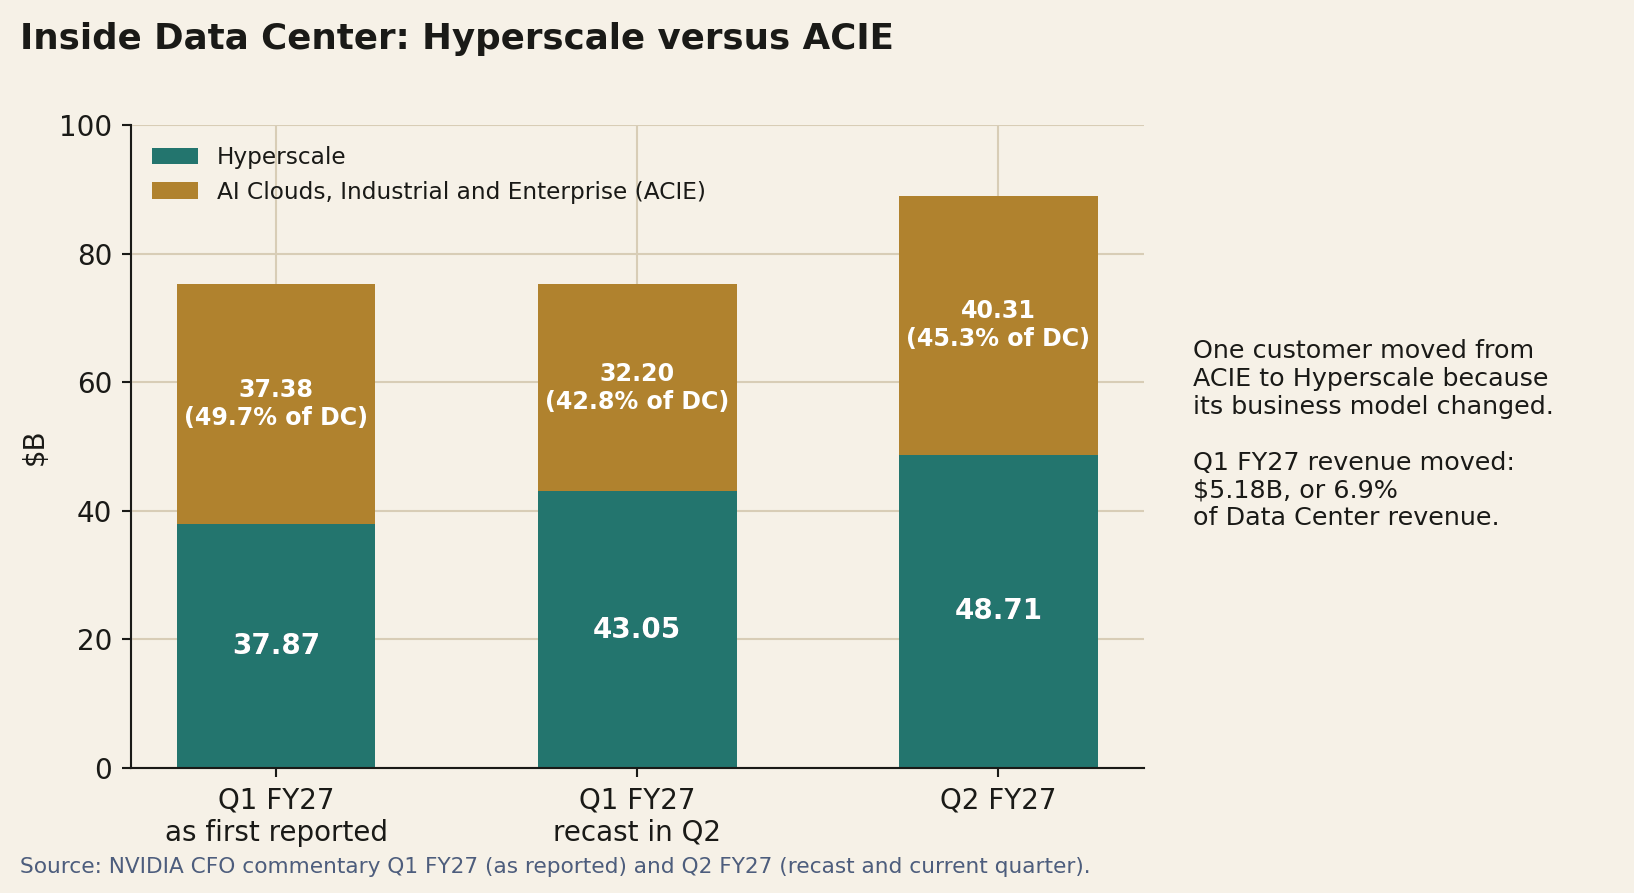
Hyperscale, which NVIDIA defines as the public clouds and the largest consumer internet companies, brought in $48.7 billion, up 13% sequentially and 102% from a year ago. ACIE, short for AI clouds, industrial and enterprise, brought in $40.3 billion, up 25% sequentially and 138% from a year ago.
On the call the CFO tied ACIE growth to capacity that neoclouds added for enterprises, AI startups and sovereign customers, and to hyperscalers buying capacity from AI clouds to supplement their own buildouts.
NVIDIA expects its neocloud partners to finish 2026 with 8 gigawatts installed, against roughly 3 gigawatts at the end of 2025, and said sovereign revenue, mostly booked through regional neoclouds, grew 35% sequentially and more than tripled year over year.
The second quarter commentary also contains a line that matters for anyone tracking this split: a company was moved from ACIE to Hyperscale because its business model changed, and prior periods were recast.
The size of the move can be read off the two commentaries. The first quarter was originally reported as $37.87 billion of Hyperscale and $37.38 billion of ACIE, so ACIE was 49.7% of Data Center.
In the recast the same quarter shows $43.05 billion and $32.20 billion, and ACIE drops to 42.8%. The difference between the two versions, $5.18 billion, is the first quarter revenue of that one customer, which NVIDIA does not name, and 6.9% of the whole Data Center line.
On the new basis, ACIE was 45.3% of Data Center in the second quarter. When NVIDIA describes the non-hyperscale business as roughly half of Data Center, as both executives did on the call, it helps to remember that a single classification decision moved that share by about seven points.
Two other statements from the call frame the customer mix. The CFO said the AI labs whose buildouts NVIDIA expects to support with its balance sheet should account for roughly a quarter of NVIDIA’s business next year.
On the hyperscale side, NVIDIA put cloud industry backlog above $2 trillion and capital expenditure by the five largest hyperscalers at nearly $800 billion in 2026 and $1.3 trillion in 2027. Those are NVIDIA’s figures, not a sum rebuilt here from each company’s guidance.
The same call announced that AWS will deploy an additional 2 million GPUs between this quarter and the second quarter of fiscal 2029.
Timeline
The data center news of the last few months, in order, with the sources used for each entry:
Jan 5. CES keynote: Vera Rubin in full production; Huang says 45°C water needs no chillers.
May 18. Quarterly dividend raised from $0.01 to $0.25 a share; $80.0 billion added to the buyback authorization.
May 31. Vera Rubin ramps into full production; DSX announced; Spectrum-X Ethernet Photonics in production.
Early July. SemiAnalysis reports a Kyber delay to 2028; NVIDIA says its roadmap is intact.
Aug 10. Financing platforms with six asset managers and banks, memorandums of understanding for more than $500 billion.
Aug 17. Guarantees for SB Energy’s PORTS-Pike campus; 8-K filed.
Aug 26. Second quarter results: $96.2 billion of revenue; Vera Rubin production shipments under way; Groq 3 LPX in full production.
Sep 9. Australia: up to 2 GW with eight partners by 2027.
Sep 10. Huang at a Goldman Sachs conference repeats $3 trillion to $4 trillion by 2030.
Sep 11. Vera Rubin NVL72 product page updated; memory and NVLink bandwidth lower than in the August version.
Oct 21. GTC Berlin keynote.
Nov 17. Third quarter results.
The rack
Production shipments of Vera Rubin started precisely in August. NVIDIA says it already holds purchase orders from every major hyperscaler, AI cloud and system OEM, and it expects Vera Rubin to be about 20% of Data Center revenue in the third quarter.
If Data Center keeps the 92.5% share of revenue it had in the second quarter, it would be about $100 billion of the $108.0 billion guide, and 20% of that is roughly $20 billion of Vera Rubin in a single quarter.
NVIDIA’s specification table for the Vera Rubin NVL72 rack gives the shape of the machine; the figures here are from the version of the page updated on September 11.
The rack holds 72 Rubin GPUs and 36 Vera CPUs. Each GPU carries 288 GB of HBM4 with 19.2 TB/s of memory bandwidth, and the rack is listed at 20.7 TB and 1,400 TB/s. NVLink 6 gives every GPU 3 TB/s of scale-up bandwidth, 216 TB/s for the rack, and NVLink-C2C links each Vera to its GPUs at 1.8 TB/s.
Each Vera has 88 custom Olympus cores and 176 threads, 3,168 cores and 6,336 threads in the rack, with up to 1.5 TB of LPDDR5X per CPU and up to 54 TB per rack. Scale-out networking is listed at 0.45 TB/s per GPU and 32.4 TB/s per rack, both bidirectional, and the inlet temperature at 45°C.
NVIDIA’s own technical blog, which I tried to read carefully before writing all of this post, adds that HBM4 doubles the interface width of HBM3e and that Rubin nearly triples memory bandwidth over Blackwell.
The same table rates the rack at 3,600 PFLOPS for NVFP4 inference and 288 PFLOPS at BF16, a factor of 12.5 on identical silicon. Its footnotes also mark the NVFP4 inference row as a sparse specification and the training, BF16 and TF32 rows as dense ones, so the headline number is not only in the most compressed format in the table but also on a different basis from the rows below it.
A comparison between generations only means something when both sides use the same precision and the same basis.
A second ratio from the table: each GPU’s NVLink bandwidth is 16% of its memory bandwidth, 3 TB/s against 19.2 TB/s. Work that has to cross GPUs inside the rack, such as tensor parallel collectives or the all-to-all traffic of mixture-of-experts models, moves over about a sixth of the bandwidth each GPU has for reading its own weights and KV cache.
NVIDIA’s performance claims for Vera Rubin use at least three baselines. The product page says the NVL72 delivers up to 10x more tokens per megawatt and one tenth the cost per million tokens compared with GB200 NVL72, both measured on Kimi-K2-Thinking with 32K input and 8K output tokens, and that it trains a 10 trillion parameter mixture-of-experts model on 100 trillion tokens in a month with a quarter of the GPUs, in NVIDIA’s projection.
The August call claimed 30x higher throughput per megawatt and 35x lower token cost against Grace Blackwell Ultra, the GB300 generation that followed GB200. The May release claimed 10x agent throughput at scale against Grace Blackwell.
If GB300 is at least as efficient per megawatt as GB200, a 30x gain over it and a gain of at most 10x over GB200 cannot both hold on the same workload and configuration; the product page itself attaches a 35x per-megawatt figure to Vera Rubin paired with LPX. All of these remain vendor figures until independent benchmarks run on shipping racks.
Around the NVL72, NVIDIA now sells what it calls a POD of five rack types working as one system: the NVL72 itself, Vera CPU racks, Groq 3 LPX, Vera BlueField-4 STX storage and Spectrum-6 SPX Ethernet.
Groq 3 LPX, NVIDIA’s first rack-scale LPU system, is in full production, with volume shipments to early adopters expected later this quarter and Nebius first in line.
Jensen Huang described it as an add-on for services that will pay for very high interactivity, with lower throughput and a higher cost per token, and said most data centers will simply run Vera Rubin NVL72.
The Vera CPU is also sold on its own. Grace revenue passed $5 billion over the trailing twelve months, Vera is already shipping to lead partners with AWS starting this quarter, and NVIDIA expects CPU revenue to more than double in fiscal 2028.
The revised table
The table above differs from the one quoted before September, and several write-ups published in the last month still carry the older numbers.
Spheron, which retrieved NVIDIA’s table on August 16, recorded 22 TB/s of HBM4 bandwidth per GPU, 1,580 TB/s per rack and 260 TB/s of NVLink 6, and NVIDIA’s own January technical blog gives NVLink 6 as 3.6 TB/s per GPU.
The page NVIDIA updated on September 11 lists 19.2 TB/s, 1,400 TB/s and 216 TB/s instead. The rack’s scale-out figure moved the other way, from the 28.8 TB/s reported in July to 32.4 TB/s. The page unfortunately does not say why.
The changes are not a single unit conversion, because the ratios differ, and the compute ratings and memory capacities match the January figures.
The new numbers can be checked against the rest of the page. The 100 MW factory table only reproduces with them: 40,000 GPUs at 19.2 TB/s is 768 PB/s, which the page rounds to 800, while 22 TB/s would give 880.
The rack total no longer equals 72 times the per-GPU figure exactly: that product is 1,382.4 TB/s against the 1,400 listed, a 1.3% rounding. Anything calculated from the old bandwidth, including the critical batch below, has to be redone.
Ratings by precision
The ratings in the table span three orders of magnitude on the same silicon. Per GPU, NVIDIA lists 50 PFLOPS for sparse NVFP4 inference, 35 for dense NVFP4 training, 17.5 for FP8 or FP6 training, 4 at FP16 or BF16 and 2 at TF32, then 130 TFLOPS at FP32 and 33 TFLOPS at FP64.
The top of that list is 1,515 times the bottom. The steps between rows are simple ratios: dense NVFP4 is exactly twice FP8, FP8 is 4.375 times BF16, BF16 is twice TF32, and TF32 is 15.4 times the plain FP32 rating. The sparse inference row sits 1.43 times above dense NVFP4 training.
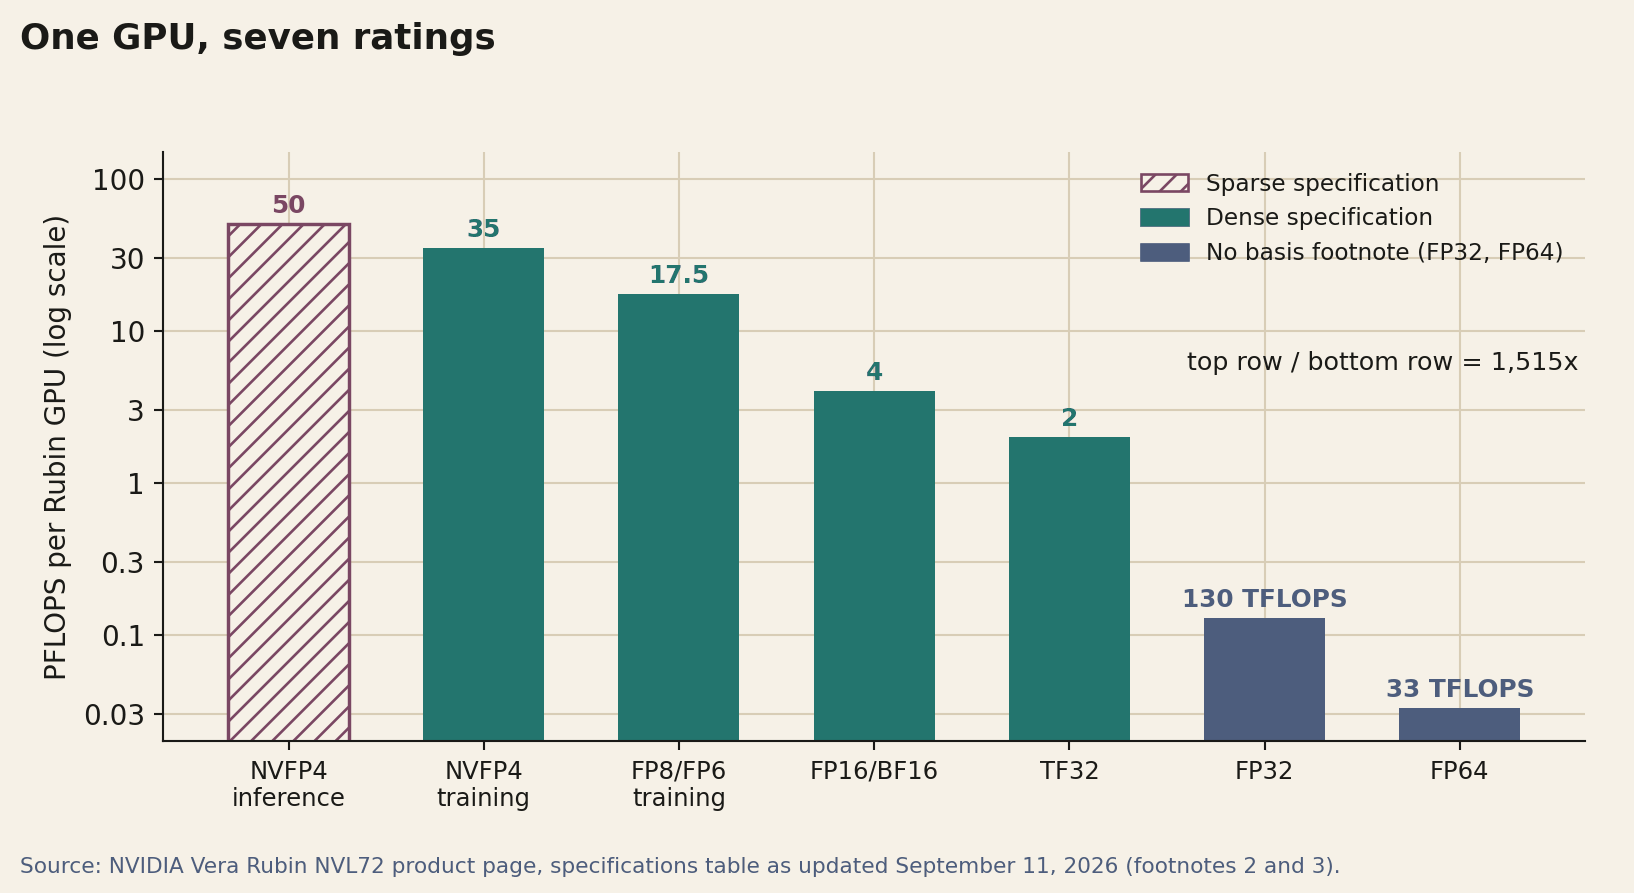
Each row answers a different question. The training rows describe dense matrix math, the sparse inference row folds in whatever sparsity NVIDIA assumed, and the FP64 row is the one that matters for classical simulation.
Ratios between a sparse row and a dense one, or between generations rated on different bases, look precise and mean little.
The critical batch
A decode step reads every active weight once and does roughly two floating point operations per active parameter for every sequence in the batch. With N active parameters stored at b bytes each, a batch of B needs N × b bytes of memory traffic and 2 × N × B floating point operations per step.
The step is limited by memory bandwidth while N × b divided by the bandwidth is larger than 2 × N × B divided by the compute rating P, and by compute beyond that. N cancels, which leaves a property of the hardware alone:
B* = P × b / (2 × B_mem)
B* is the batch per model replica above which adding sequences stops being free. It counts weights only, at zero context. Longer contexts add KV cache reads for every sequence, which on their own push the real crossover higher, and at long enough contexts no batch makes the step compute-bound at all; attention compute, which also grows with context, pulls the other way.
B* also only makes sense with dense ratings, because the sparse row already assumes less work per parameter than the formula does. The model behind this post enforces that: each rating carries a basis field, and the function refuses a sparse one.
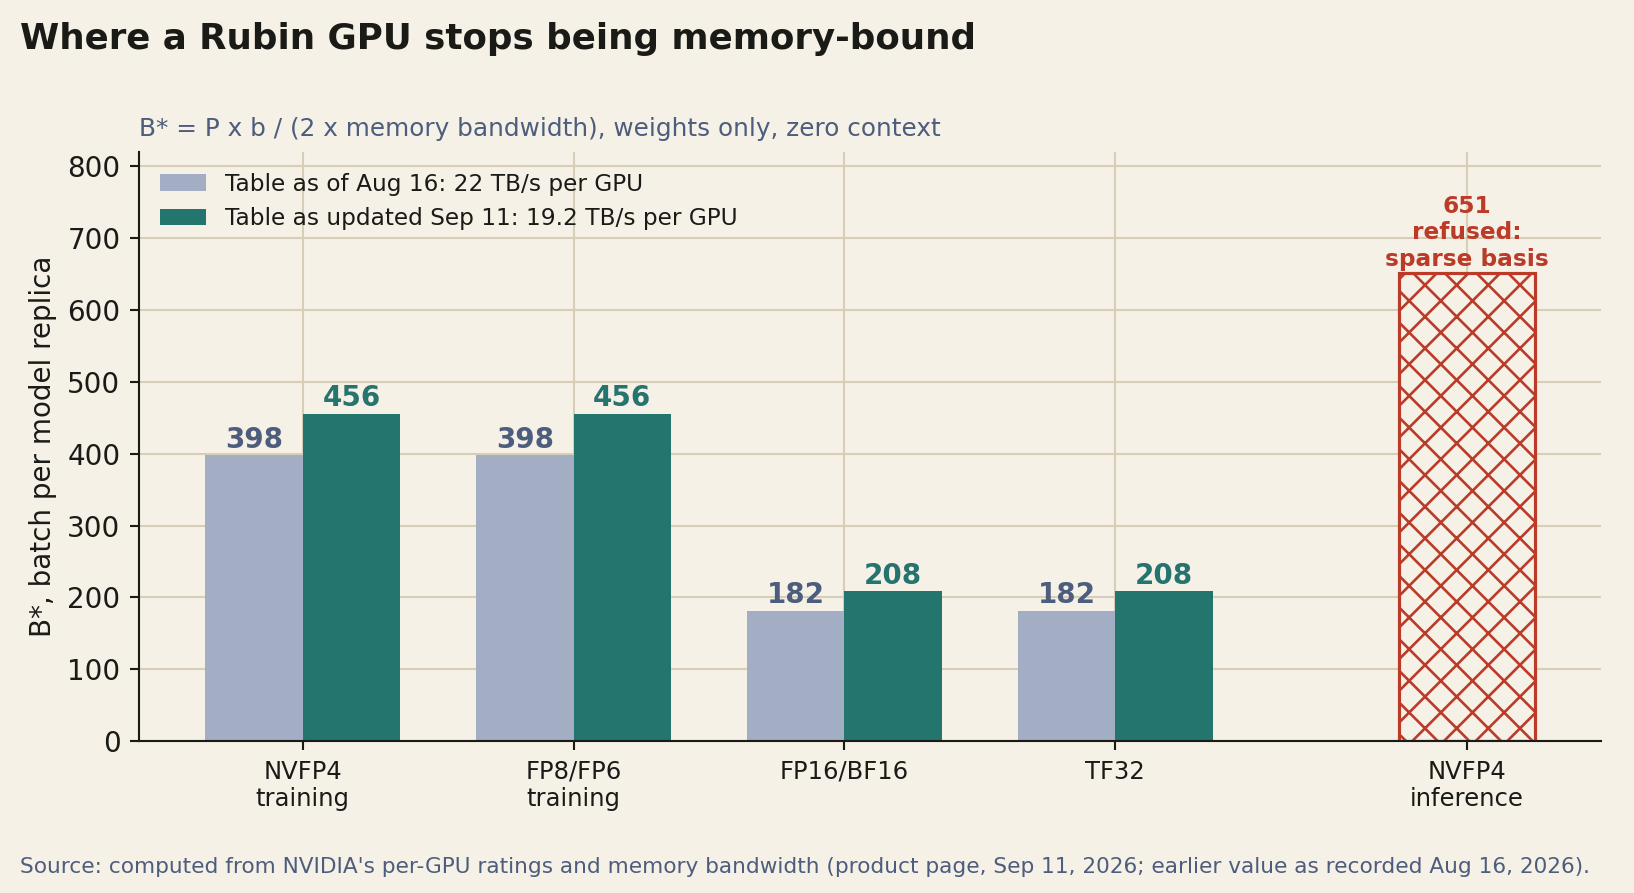
With the September 11 bandwidth of 19.2 TB/s, the dense rows give B* of 456 for NVFP4 and FP8 training and 208 for BF16 and TF32. The pairs match exactly because each rating scales with the inverse of its bytes per parameter: 35 × 0.5 and 17.5 × 1 give the same product, and so do 4 × 2 and 2 × 4.
With the old 22 TB/s, the same rows gave 398 and 182, so the revision moves the crossover 14.6% higher: a Rubin GPU stays memory-bound at larger batches than the earlier table implied. Plugging in the sparse inference row anyway would give 651, a number that describes nothing.
The memory ladder
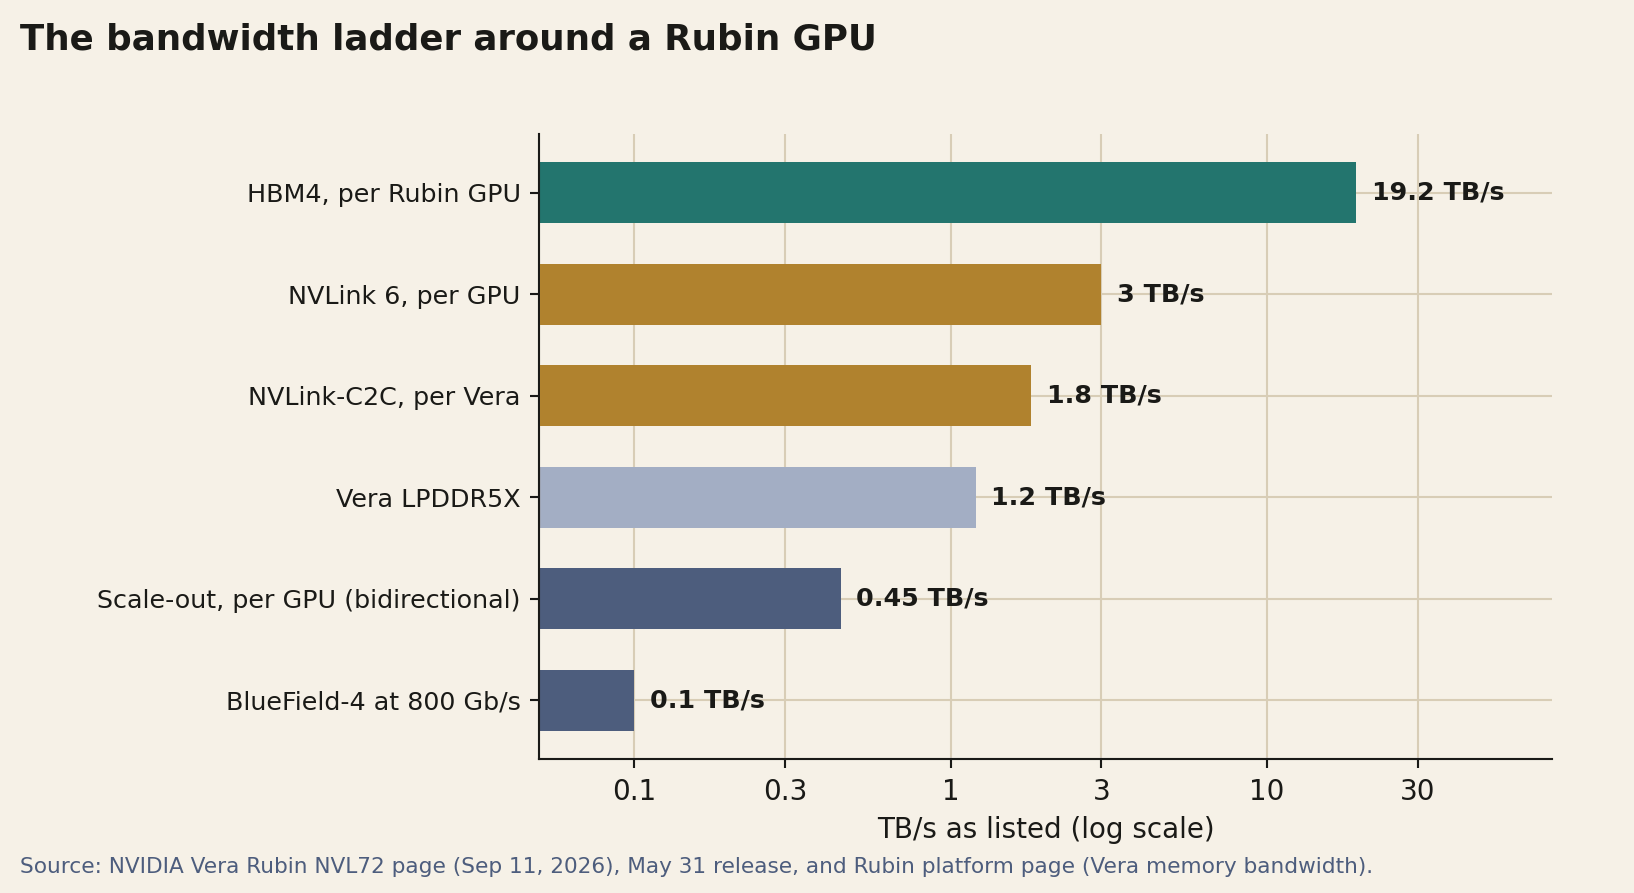
Bandwidth falls sharply at each step away from the GPU’s own memory. Per GPU, NVIDIA lists 19.2 TB/s for HBM4, 3 TB/s for NVLink 6 and 0.45 TB/s for scale-out networking; each Vera connects at 1.8 TB/s over NVLink-C2C; and BlueField-4 runs at up to 800 Gb/s, which is 0.1 TB/s NVIDIA’s Rubin platform page gives Vera’s own LPDDR5X band.
width as up to 1.2 TB/s, the figure VideoCardz also reported from CES. On the figures as listed, local HBM4 is 6.4 times NVLink, 10.7 times NVLink-C2C, 16 times Vera’s memory and 42.7 times the scale-out figure.
Those ratios turn into time when data has to move. Assuming each interconnect figure counts both directions, as the product page states for scale-out and NVIDIA’s NVLink page states for NVLink, one direction carries half.
On that basis, and taking BlueField-4’s 800 Gb/s as a single direction, 100 GB takes about 67 milliseconds over NVLink 6, 111 milliseconds over NVLink-C2C, 444 milliseconds over the scale-out network and 1 second through BlueField-4, while a GPU reads 100 GB from its own HBM4 in about 5.2 milliseconds.
The rack holds 20.7 TB of HBM4 and up to 54 TB of LPDDR5X behind NVLink-C2C, 74.7 TB in all, and NVIDIA’s 100 MW factory table counts 12 PB of HBM4 and up to 30 PB of LPDDR5X across 40,000 GPUs, which it calls 42 PB of fast memory.
Whatever does not fit in that tier, KV cache for long agent sessions included, sits behind links that are several times slower.
SRAM next to HBM
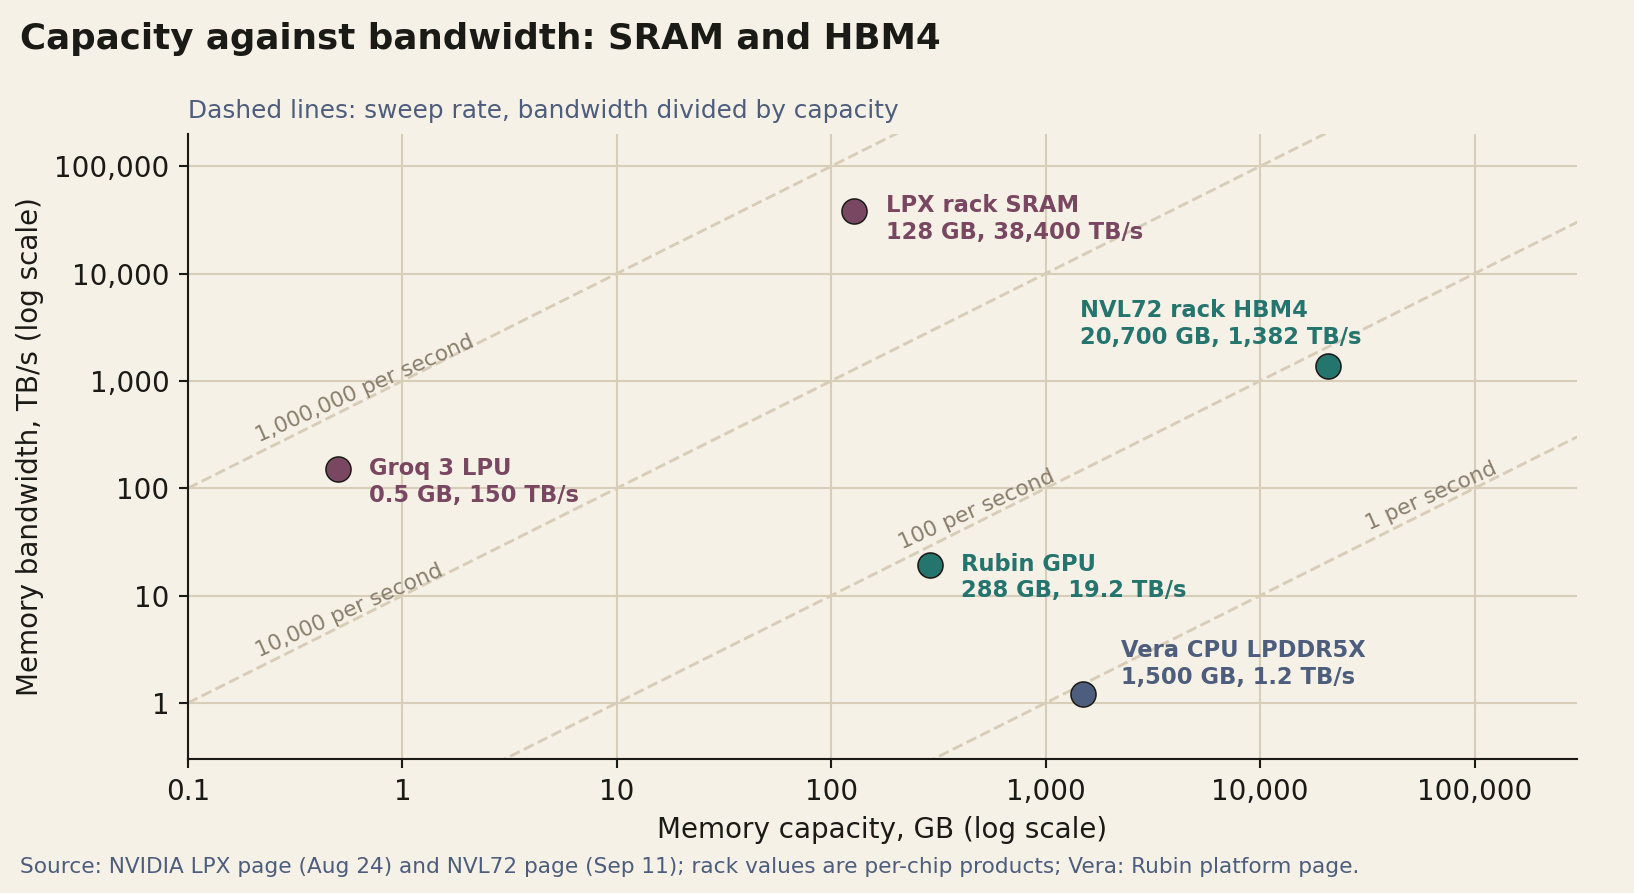
The Groq 3 LPX rack makes the opposite trade. NVIDIA’s page lists 256 LPUs per rack, each with 500 MB of SRAM, 150 TB/s of SRAM bandwidth and 2.5 TB/s of scale-up bandwidth, which gives 128 GB of SRAM, about 40 PB/s of SRAM bandwidth and 640 TB/s of chip-to-chip bandwidth per rack, plus 12 TB of DDR5 for larger models.
Against a Vera Rubin NVL72, an LPX rack has about 162 times less accelerator memory, SRAM against HBM4, and about 28 times more accelerator memory bandwidth.
A compact way to compare the two is the sweep rate, bandwidth divided by capacity: how many times per second a chip could read its entire memory. A Rubin GPU sweeps its 288 GB about 67 times a second. A Groq 3 LPU sweeps its 500 MB 300,000 times a second, 4,500 times as often.
If a chip’s memory were full of weights that every token has to read, the sweep rate would be its ceiling on tokens per second at batch one.
The limit is capacity: at 500 MB per chip, a trillion-parameter model cannot live in SRAM alone, which is why NVIDIA positions LPX as an accelerator for Vera Rubin and says the GPUs and LPUs jointly compute every layer for every output token.
Networking
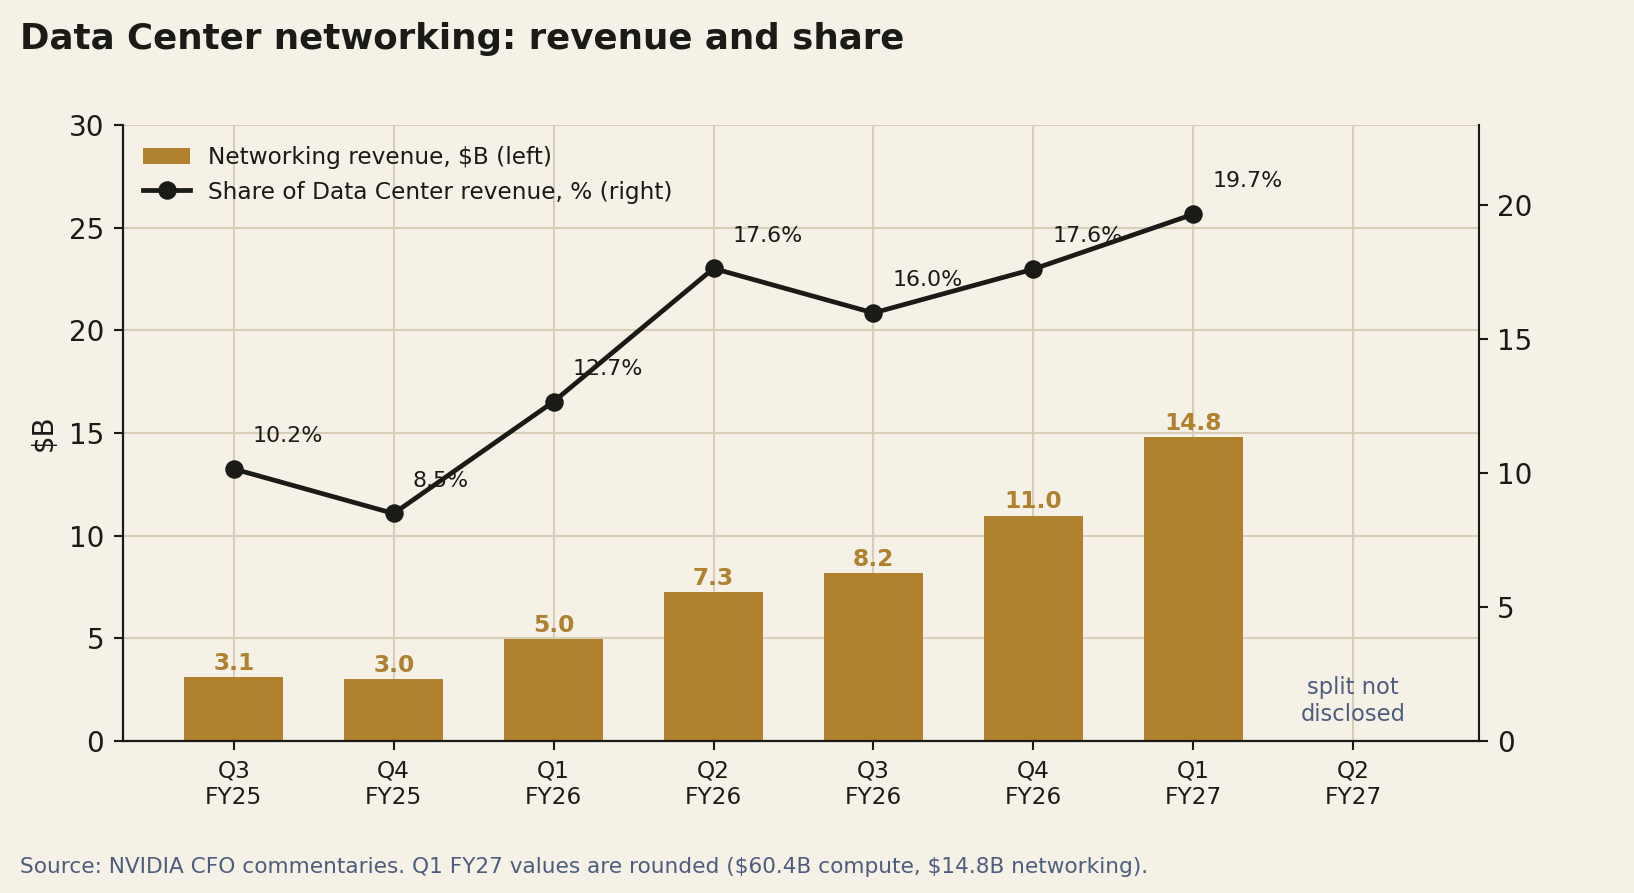
Networking is the part of the rack that grew fastest. Data Center networking revenue went from $3.0 billion in the fourth quarter of fiscal 2025 to $14.8 billion in the first quarter of fiscal 2027, 4.9 times in five quarters, and from 8.5% to 19.7% of Data Center revenue.
For the whole of fiscal 2026 it was $31.4 billion, up 142%. The fourth quarter commentary credited the NVLink compute fabric of GB200 and GB300 systems along with the growth of Ethernet and InfiniBand.
The second quarter commentary no longer splits Data Center into compute and networking. On the call NVIDIA said networking revenue grew 18% sequentially and that Spectrum-X Ethernet grew 2.6 times year over year.
If that 18% applies to the same line as the first quarter’s $14.8 billion, second quarter networking was about $17.5 billion. That is an estimate made here, not a reported number.
Spectrum-X Ethernet Photonics, which NVIDIA describes as the first co-packaged optics switches with 200 Gb/s SerDes, is in production, and NVIDIA claims 5x better power efficiency, 5x longer uptime and 1.3x faster deployment than networks built on traditional transceivers.
In the second quarter NVIDIA said Spectrum-6 switch systems supporting both pluggable and co-packaged optics are arriving in gigascale AI factories. NVIDIA’s case for co-packaged optics is made at the facility level: power the optics no longer burn is power the operator can give to compute.
Per GPU, the September 11 table puts scale-up at 3 TB/s and scale-out at 0.45 TB/s, as NVIDIA lists them, a ratio of 6.7. The same page names the rack’s scale-out fabrics, Quantum-X800 InfiniBand and Spectrum-X Ethernet, alongside the ConnectX-9 SuperNICs and BlueField-4 DPUs inside it.
Kyber
The rack after this one is under more pressure. Jen Huang said at GTC in March 2025 that each Kyber rack for Rubin Ultra would draw 600 kW.
In early July, SemiAnalysis reported that Kyber had slipped to 2028 because its printed circuit midplane is hard to manufacture, and that a stopgap design joining two current racks back to back had been dropped after large customers objected.
Tom’s Hardware, reporting those claims, cites trade analyses describing a 78-layer board and notes that Kyber holds 144 GPU packages against 72 in the current Oberon rack.
NVIDIA’s reply to the publication was four words: “Our roadmap is intact.” The reported delay does not touch Vera Rubin, which uses the current rack.
The gigawatt
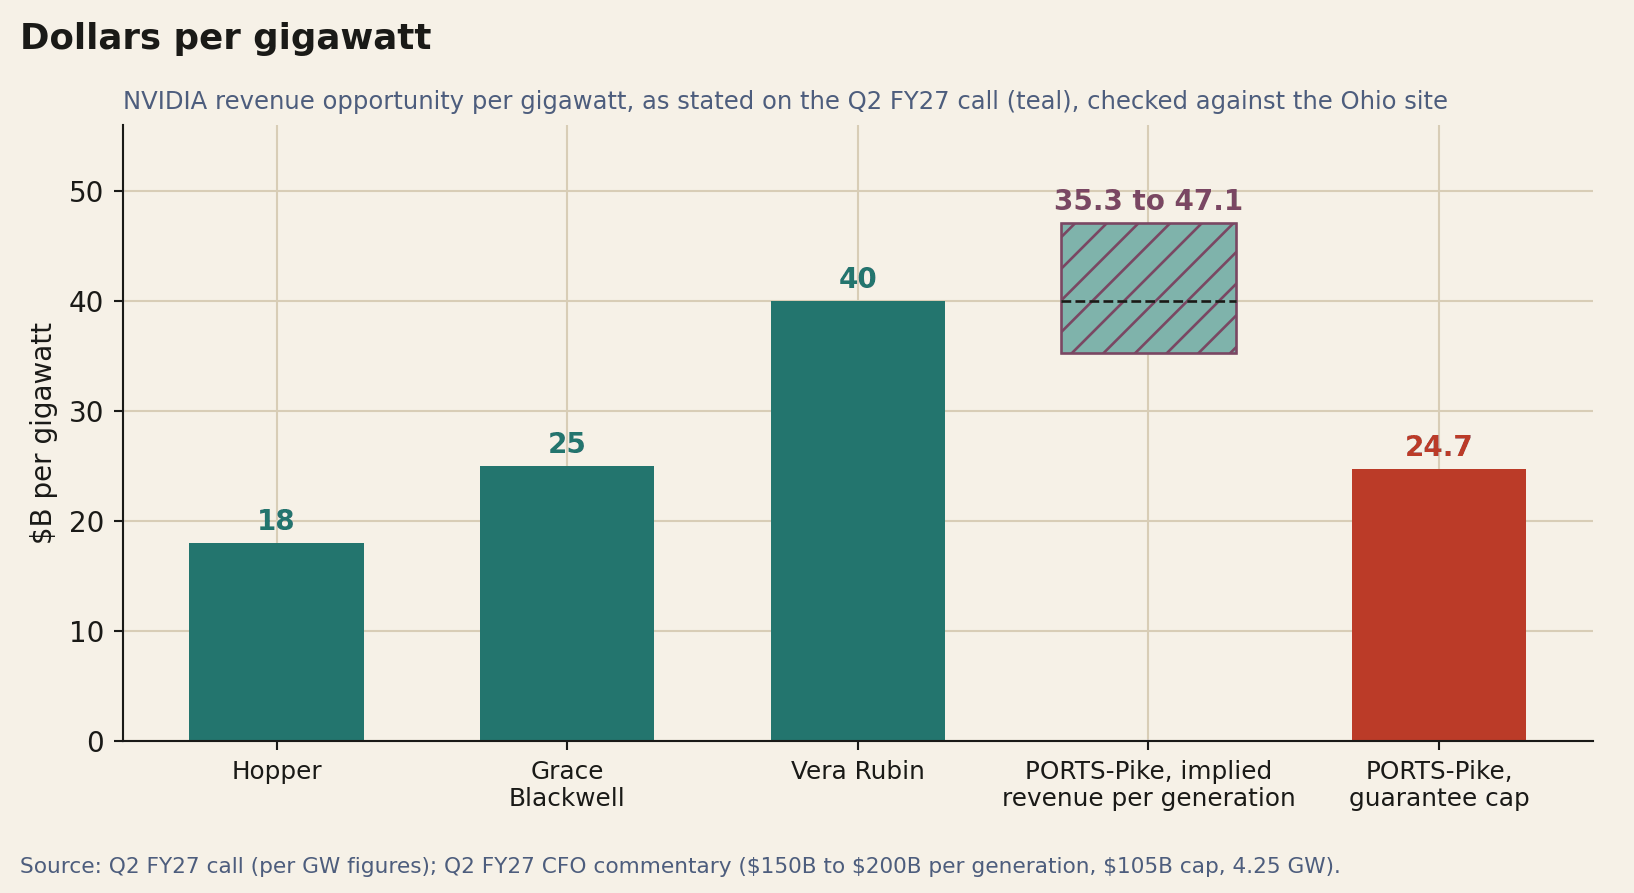
On the call NVIDIA offered a way to measure its share of a buildout: revenue opportunity per gigawatt. It put Hopper at about $18 billion, Grace Blackwell at about $25 billion and Vera Rubin at about $40 billion, with the Vera Rubin figure covering the Vera CPU, the Rubin GPU, NVLink, InfiniBand or Ethernet, and the Groq LPU.
That is 2.2 times the Hopper figure in two generations. Huang also said the total investment in a gigawatt of data center has gone from about $30 billion five years ago to about $60 billion today. If both statements describe the same gigawatt, NVIDIA’s content is about two thirds of it.
The Ohio disclosure gives a second way to check the $40 billion figure. NVIDIA says each generation of its infrastructure deployed at PORTS-Pike could represent about 1.5 million GPUs, or $150 billion to $200 billion of NVIDIA revenue.
On the call that statement follows the description of the initial 4.25 gigawatts, and reading it that way gives $35.3 billion to $47.1 billion per gigawatt; $40 billion times 4.25 is $170 billion, inside the range, which supports that reading.
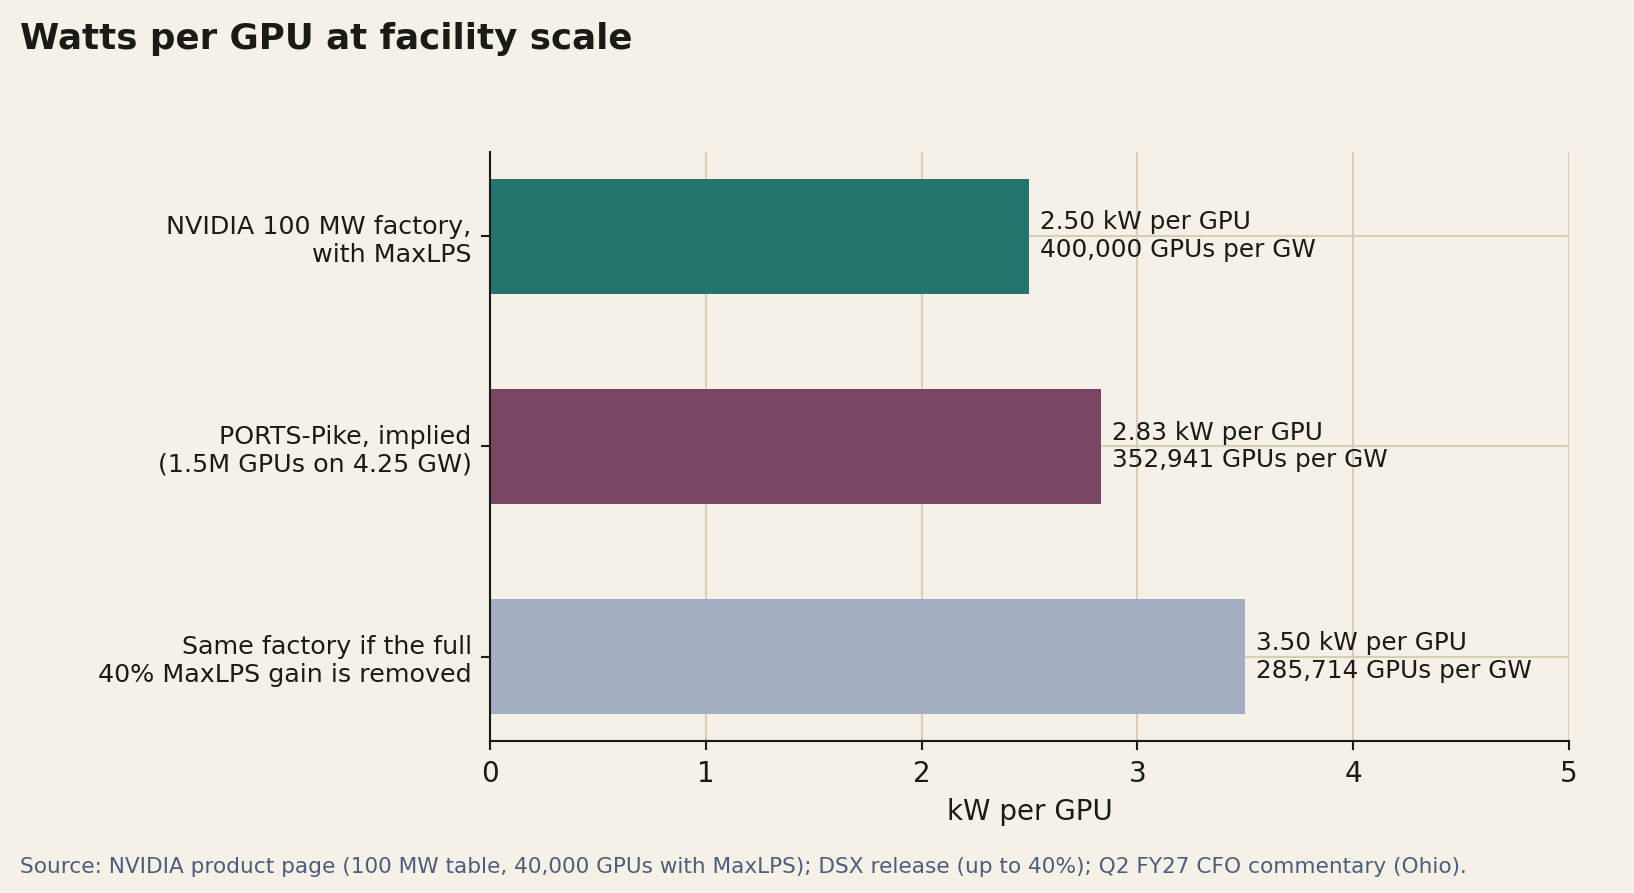
The same numbers give about 353,000 GPUs per gigawatt, or 2.83 kW of IT load per GPU once everything else inside the IT envelope, from CPUs to switches to storage, is divided among the GPUs, and $100,000 to $133,000 of NVIDIA revenue per GPU.
The product page gives a third data point. NVIDIA’s 100 MW factory table, built on DSX with MaxLPS, counts 40,000 Rubin GPUs, which is 2.5 kW per GPU or 400,000 GPUs per gigawatt.
If the MaxLPS gain of up to 40% applied in full, the same site without it would hold fewer GPUs at 2.5 kW × 1.4, or 3.5 kW each. The Ohio figures, 2.83 kW per GPU and 88.2% of the MaxLPS density, fall between the two.
The bases are not identical, since the Ohio numbers are per IT gigawatt and the factory table does not say whether its 100 MW is IT load, so the comparison shows consistency rather than proof.
Power
Most of what changes at the facility level comes from power. NVIDIA’s own description of the problem is that racks today distribute 54 V DC over copper busbars, that GB200 and GB300 NVL72 racks use up to eight power shelves, that a Kyber rack at megawatt scale would need up to 64U of power shelves on 54 V, and that a single 1 MW rack on 54 V would need up to 200 kg of copper busbar.
Its answer is 800 V DC distribution. NVIDIA says row-level 800 V DC busways can move 85% more power than 415 V AC through the same conductor size and reduce copper requirements by 45%, and that the architecture improves end-to-end efficiency by up to 5%. It has also said full-scale production of 800 V DC data centers will coincide with Kyber.
The arithmetic behind the change is Ohm’s law. A 600 kW rack at 54 V draws about 11,100 amps; at 800 V it draws 750 amps, 14.8 times less. Resistive loss scales with the square of the current, so the same conductor would dissipate about 219 times less heat, and that margin is what lets a designer use far less copper instead.
The calculation leaves out conversion stages and distances, which differ between the two designs, but it shows why the voltage had to change. It also ties the facility to the rack: if Kyber slips, so does the point at which NVIDIA expects 800 V DC to reach full scale.
Cooling moved in the same direction. The September 11 table lists a 45°C inlet for the rack, and at CES in January Huang said the power of Vera Rubin is twice that of Grace Blackwell while the airflow is about the same and the water still enters at 45°C, and that at that temperature data centers need no water chillers. The product page does not list a rack power figure.
The physics of warm water is simple: heat carried equals mass flow times specific heat times the temperature rise, so removing 100 kW with a 10 K rise takes about 145 liters of water per minute, and doubling the rise to 20 K halves the flow to about 72 liters. Whenever the outdoor air is cooler than the water coming back from the racks, the heat can be rejected by dry coolers with fans and no compressor, and a warmer loop makes that true for more hours of the year than a colder one.
Assembly is the other constraint NVIDIA keeps pointing at. Its January technical blog says the modular compute and switch trays enable up to 18x faster assembly, its Rubin platform page says the comparison is against Blackwell, and Thunder Compute describes assembly time going from over an hour and a half to about five minutes, a ratio that matches. The product page adds that the rack uses cable-free modular trays and is supported by more than 80 MGX ecosystem partners.
The DSX platform is NVIDIA’s attempt to sell the facility layer as a reference design. It bundles validated designs that cover compute, networking, storage, power and cooling, a simulation layer called DSX Sim, grid integration called DSX Flex, open source operations software called DSX OS, and DSX MaxLPS, which NVIDIA says combines 45°C liquid cooling with in-rack technologies so an operator can run up to 40% more GPUs at their most efficient operating point inside a fixed power budget.
The trade is easy to state: 1.4 times the GPUs comes out ahead as long as each GPU gives up less than 28.6% of its throughput. NVIDIA says the impact on workload performance is minimal, and the announcement does not include the curve. DSX Flex is running a multi-megawatt pilot with Emerald AI and Silicon Valley Power that adjusts AI factory load to grid signals.
The sites are getting larger and more specific. PORTS-Pike is being developed on the grounds of the decommissioned Portsmouth Gaseous Diffusion Plant in Pike County, Ohio, with capacity coming online in phases from 2028. SB Energy and SoftBank plan at least 10 GW of new generation to support 8 GW of IT capacity, all of it for OpenAI, plus at least $4.2 billion of regional grid investment, and NVIDIA is investing $1.5 billion in SB Energy.
The ratio of planned generation to IT capacity there is 1.25. In Australia, NVIDIA announced on September 9 that eight cloud and data center partners there are expanding land, power and shell to host its DSX factories, with up to 2 GW by 2027.
At a Goldman Sachs conference the next day, Huang repeated his estimate of $3 trillion to $4 trillion of AI infrastructure spending by 2030 and acknowledged that land and power could slow deployment.
Memory
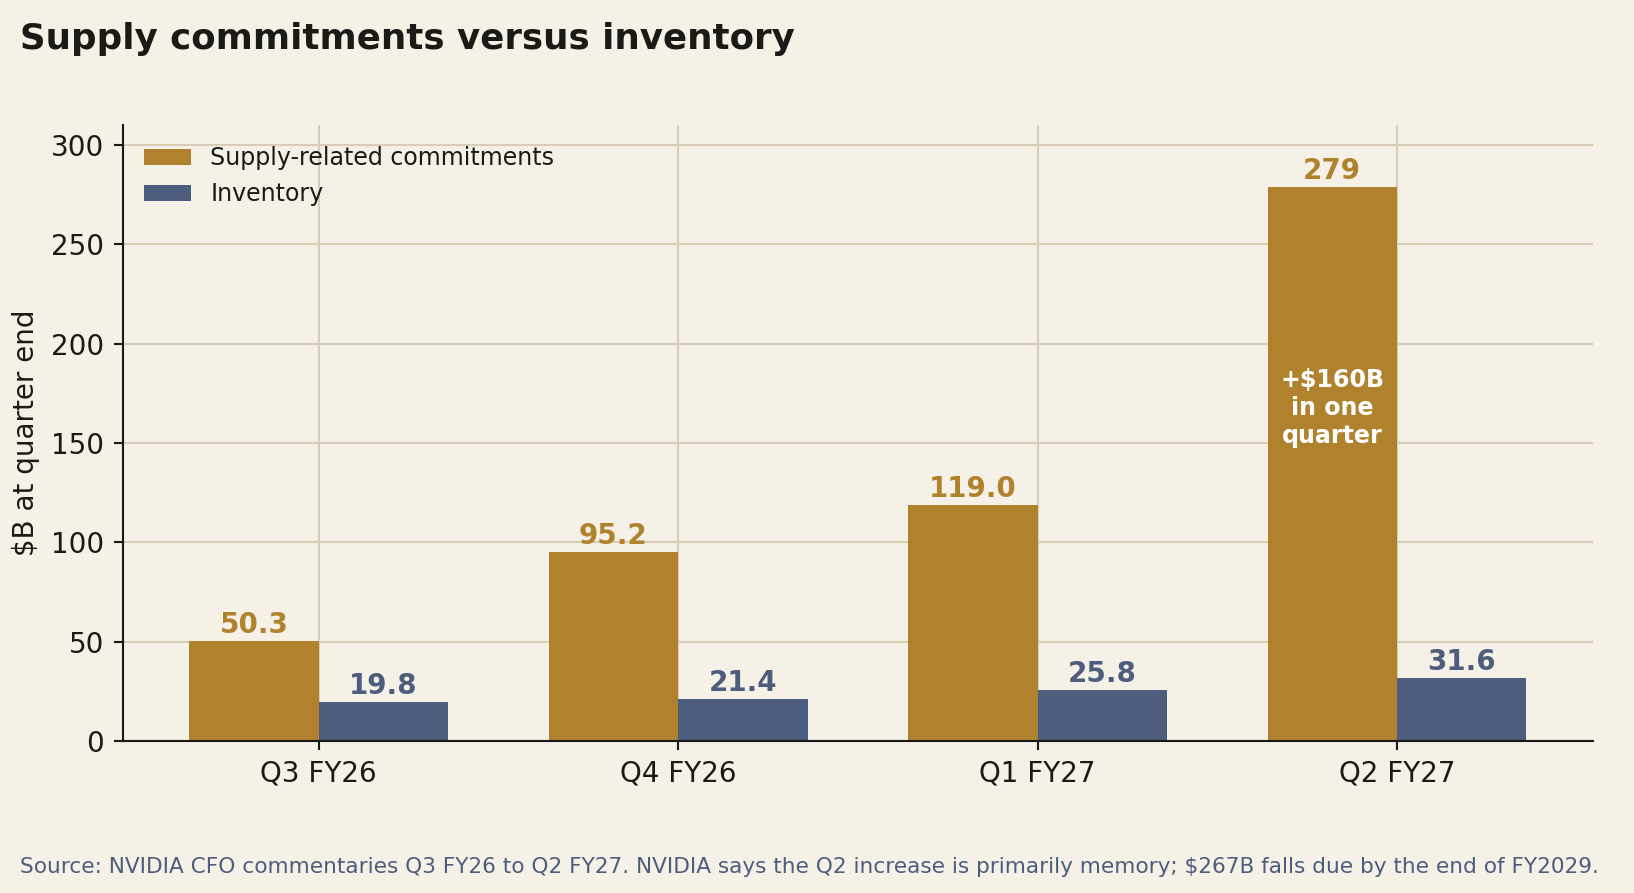
Supply-related commitments were $50.3 billion at the end of the third quarter of fiscal 2026, $95.2 billion a quarter later, $119.0 billion at the end of the first quarter of fiscal 2027, and $279 billion now.
That is 5.5 times in three quarters, with $160 billion added in the last quarter alone and attributed mainly to memory. By fiscal year, $92 billion falls due in the rest of fiscal 2027, $87 billion in fiscal 2028 and $88 billion in fiscal 2029, so $267 billion, or 96%, is due by the end of fiscal 2029.
The 10-Q says the commitments cover data center infrastructure systems, primarily memory and manufacturing facilities, and that some of the underlying agreements can be cancelled, rescheduled or adjusted before firm orders are placed, possibly at additional cost.
For scale: at the third quarter guide, one quarter of cost of revenue is about $28.1 billion, which is $108.0 billion times one minus the 74.0% margin. The $92 billion due in the rest of fiscal 2027 is about 3.3 quarters of that, and two quarters at that rate come to about $56.2 billion. Inventory rose from $19.8 billion to $31.6 billion over the same three quarters, and NVIDIA ties the latest increase to the Vera Rubin introduction.
Whatever is not consumed by shipments in those two quarters has to show up as inventory, as prepayments, or as capacity paid for ahead of fiscal 2028, when NVIDIA plans to grow about 70%. The filing does not break the $92 billion down.
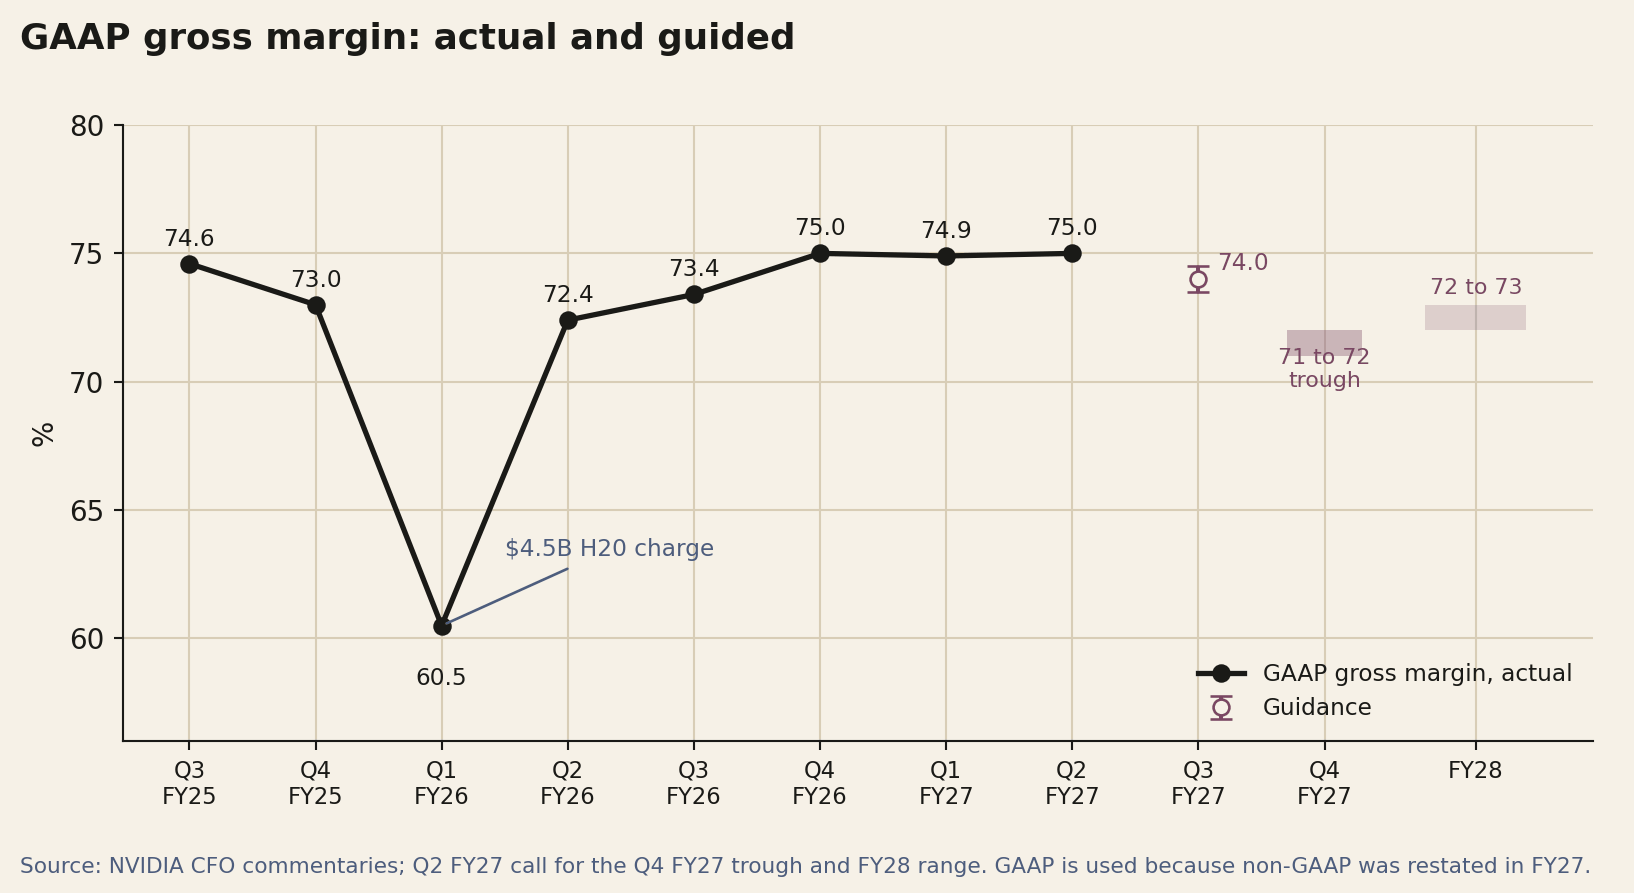
The margin guide points the same way. The CFO described “extreme pricing conditions in memory,” said the increases had exceeded NVIDIA’s expectations and would go higher next year, and reset the outlook: 74.0% gross margin in the third quarter, plus or minus 50 basis points, a trough of 71% to 72% in the fourth quarter, and 72% to 73% in fiscal 2028 as price increases NVIDIA has already executed take effect in its first quarter.
On a GAAP basis the second quarter was 75.0%, the same as the fourth quarter of fiscal 2026. The only large dip in the eight quarters charted was the 60.5% of the first quarter of fiscal 2026, when NVIDIA took a $4.5 billion charge on H20.
Put per $100 of revenue, cost of revenue is $25.00 at the second quarter’s 75.0% margin, $26.00 at the third quarter guide, $28.50 at the midpoint of the fourth quarter trough and $27.50 at the midpoint of the fiscal 2028 range: 4%, 14% and 10% more cost for each dollar of sales than in the second quarter.
Rubin is built around HBM4, 288 GB per GPU in NVIDIA’s specification. On the call NVIDIA said it works with all three major memory suppliers to add the capacity its roadmap requires, and in the second quarter it announced a multiyear technology partnership with SK hynix.
Credit
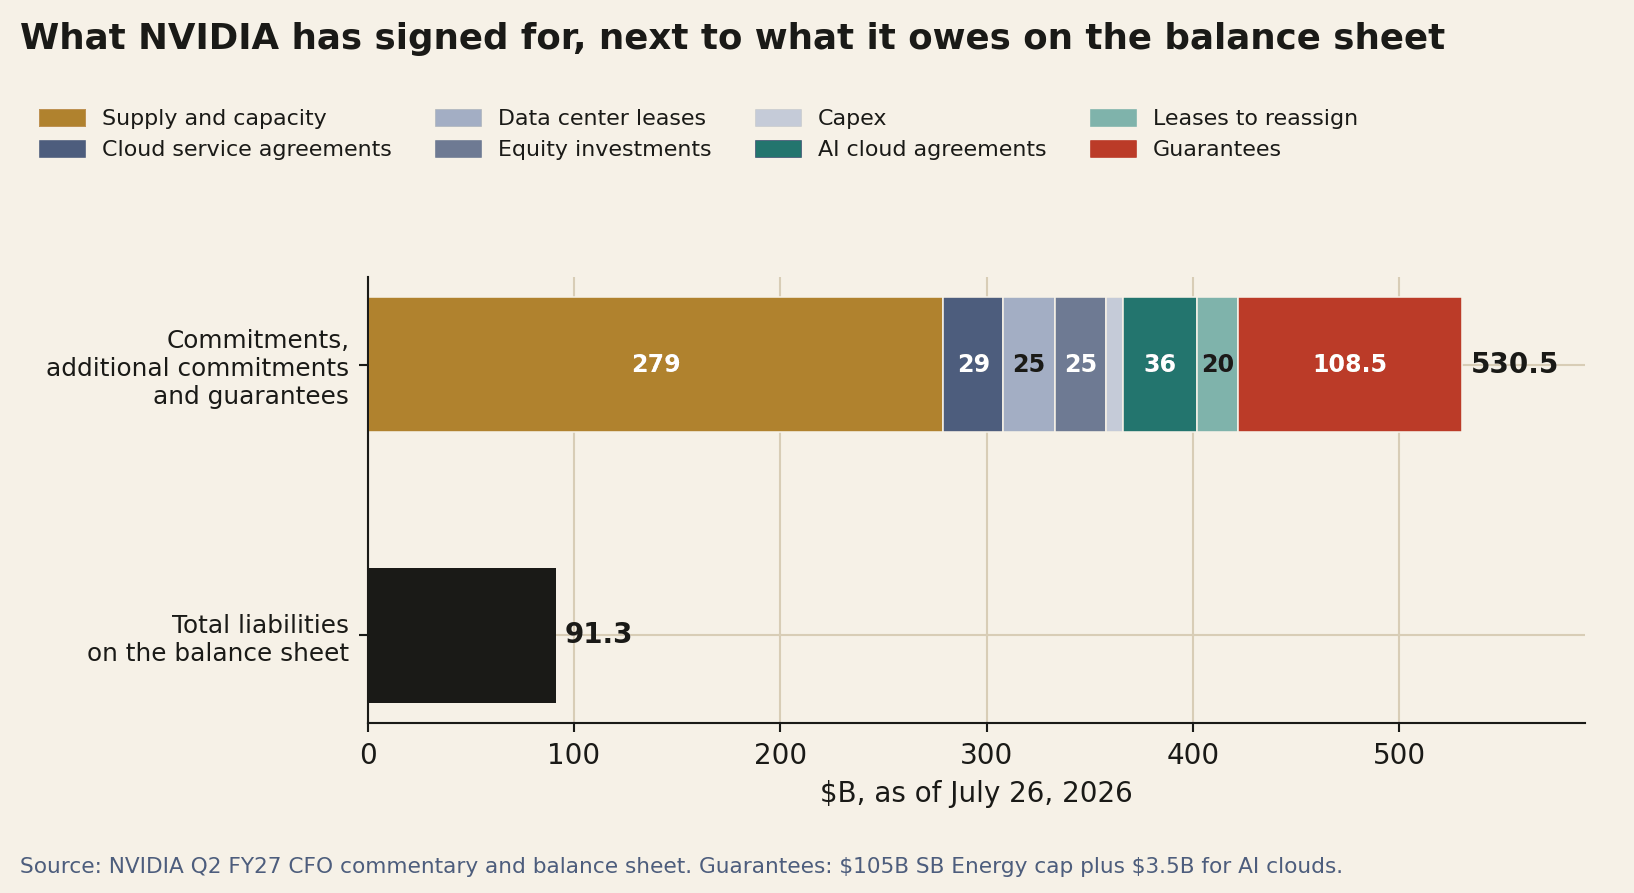
The full list, as of July 26, 2026, is in the CFO commentary. Commitments total $366 billion: $279 billion for supply and capacity; $29 billion of cloud service agreements that support NVIDIA’s own research, open models and autonomous vehicle software; $25 billion of data center leases that have not started, with terms of up to 20 years beginning between the third quarter of fiscal 2027 and fiscal 2033; $25 billion of equity investments in AI model makers, infrastructure financiers and other private companies; and $8 billion of capital expenditure.
Additional commitments total $56 billion: $36 billion of AI cloud agreements, and $20 billion of leases with terms of about 15 years, starting in fiscal 2028 or 2029, that NVIDIA expects to reassign.
Guarantees add $108.5 billion. The sum, $530.5 billion, is 5.8 times the $91.3 billion of total liabilities on the balance sheet and 1.75 times the $303.0 billion of revenue over the last four quarters. The sum mixes firm purchase obligations with a contingent maximum exposure, so it is a ceiling rather than a bill.
The AI cloud agreements are the new commercial structure. NVIDIA earns revenue on the upfront sale of the infrastructure and, if certain criteria are met, takes part of the revenue the AI cloud earns from its own customers.
On the call the CFO explained the mechanics. NVIDIA commits to take or pay for part of a facility’s capacity, which gives lenders a minimum revenue to underwrite, and in exchange shares in the neocloud’s revenue above that floor. NVIDIA says independent capital still underwrites each deal, that it is not making loans, and that it gets paid twice, once for the hardware and again from rental income.
The Ohio guarantees are residual value guaranties, and the 8-K describes how they work. There are several agreements tied to the leases, covering about 4.25 GW of IT load in total. Each generally becomes effective when its lease commences, total payment obligations are capped at $105 billion, and payment is conditional, among other things, on the lessor meeting ready-for-service conditions, expected from 2028.
The trigger events are an OpenAI insolvency that causes a lease default, or OpenAI failing to pay under a lease. In either case NVIDIA pays roughly the shortfall between a guaranteed minimum value of the lease and whatever is recovered by reletting or selling, and it can choose to assume the lease, have the lessor try to relet, start a sale, let the lease terminate, or defer for up to a year while covering specified costs.
The CFO commentary adds that the exposure declines as OpenAI pays rent, and that NVIDIA has the option to support about 3.8 GW more. Data Center Frontier reports that OpenAI has agreed to reimburse NVIDIA for amounts it actually pays.
In effect, NVIDIA is guaranteeing the longest-lived layer of the site (land, power and shell under 20-year leases) in order to sell the shortest-lived one (compute that NVIDIA expects to upgrade several times over those 20 years).
The cap works out to $24.7 billion per gigawatt, and to between 52.5% and 70% of the revenue NVIDIA attaches to a single generation of hardware at the site. What NVIDIA would actually lose in a default is not the rent itself but the gap between the guaranteed value and what a powered shell of that size would fetch from a new tenant or a buyer at that moment.
The rest of the lab exposure came out on the call. NVIDIA has invested nearly $50 billion in frontier AI labs. For another lab, which it did not name, it will provide selective credit enhancement for nearly 2 GW of compute. OpenAI’s existing and planned commitments add up to about 12 GW of NVIDIA compute.
The financing platforms NVIDIA announced on August 10 with six large asset managers and banks aim to mobilize more than $500 billion of third-party capital, but they rest on memorandums of understanding and remain subject to final agreements.
The CFO anticipated the obvious objection, that this is circular financing, and answered that NVIDIA compute is fungible and can be redeployed to other customers, which in NVIDIA’s view limits the risk.
Cash
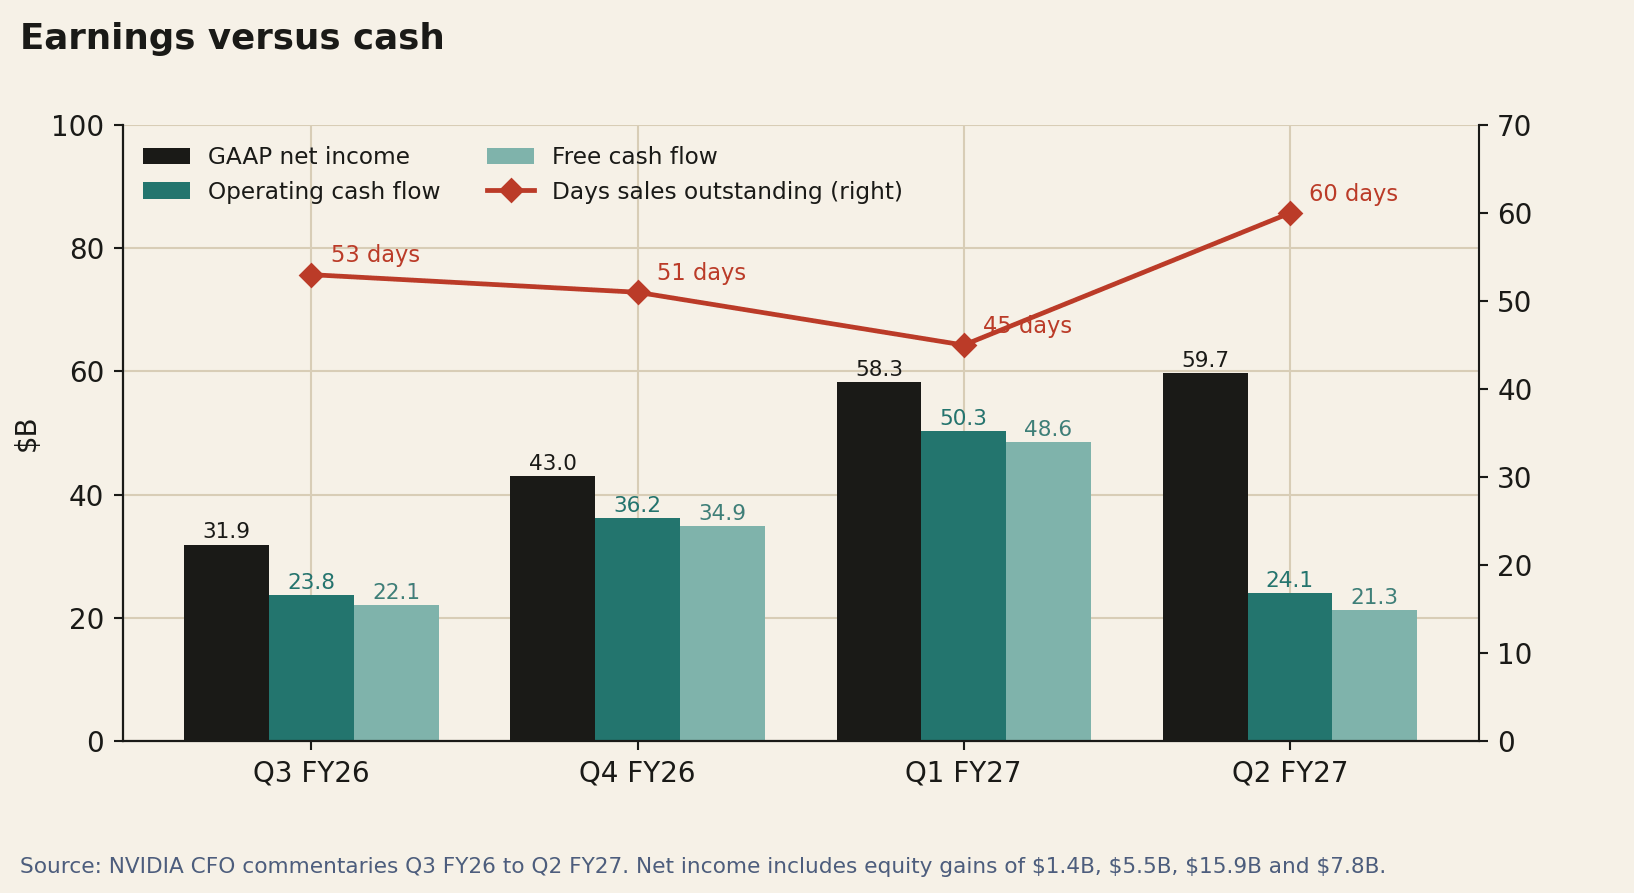
GAAP net income was $59.7 billion in the quarter, operating cash flow $24.1 billion and free cash flow $21.3 billion, against $58.3 billion, $50.3 billion and $48.6 billion in the first quarter. Operating cash flow was 40% of net income, down from 86%. The CFO commentary attributes the sequential decline to higher working capital and cash taxes.
The cash flow statement shows the working capital part: receivables absorbed $22.3 billion, inventories $5.8 billion, and prepaid expenses and other assets $5.5 billion, and net income included $7.8 billion of non-cash, pre-tax gains on equity securities.
Days sales outstanding rose from 45 to 60, which NVIDIA attributes to extended payment terms on large multi-quarter agreements with certain investment-grade customers.
The balance sheet has changed shape as well. Marketable equity securities of $42.8 billion and non-marketable securities of $51.2 billion total $93.9 billion, up from $35.1 billion at January 25 and now larger than the $56.6 billion of cash and marketable debt securities. In the first half of the fiscal year NVIDIA spent $42.4 billion on purchases of equity securities and booked $23.7 billion of net gains on them.
Total debt is $33.4 billion after $25.0 billion of senior unsecured notes issued in the quarter, against $8.5 billion at January 25, and financing activities include a $2.9 billion outflow labeled Groq, Inc.
Cash paid for buybacks and dividends was $25.8 billion ($19.7 billion and $6.0 billion), which NVIDIA describes as approximately $26.0 billion returned. The quarterly dividend went from $0.01 to $0.25 a share after a board decision on May 18, and $99.0 billion of buyback authorization remains.
November 17
NVIDIA reports its third quarter on November 17. The numbers above give a short list of things to check in that release: revenue against the $108.0 billion guide, and whether it clears the $117.3 billion that would keep growth accelerating;
Vera Rubin’s share of Data Center against the 20% NVIDIA expects; gross margin at 74.0% on the way to the fourth quarter trough; days sales outstanding against this quarter’s 60; and the supply line against inventory, which shows whether the commitments are turning into goods or into capacity reserved for later. Before that, Huang gives a keynote at GTC Berlin on October 21.
Reproduce the numbers
Every value marked M in the dossier comes from arithmetic on the sources, and the core of it fits in a short Python script with no dependencies. It prints the values used above.
# Inputs come from the NVIDIA filings and product pages listed under Sources.
rev = {"Q2FY26": 46743, "Q3FY26": 57006, "Q2FY27": 96221}   # $ millions

# Q3 FY27 revenue needed to keep year-over-year growth accelerating ($B)
print(round(rev["Q3FY26"] * rev["Q2FY27"] / rev["Q2FY26"] / 1000, 1))

# Q1 FY27 revenue moved from ACIE to Hyperscale by the recast ($B)
print((43050 - 37869) / 1000)

# Critical batch, weights only, zero context: B* = P * b / (2 * B_mem)
def b_star(pflops, bytes_per_param, bandwidth_tbs):
    return pflops * 1e15 * bytes_per_param / (2 * bandwidth_tbs * 1e12)

print(round(b_star(17.5, 1.0, 19.2)), round(b_star(4, 2.0, 19.2)))   # Sep 11 table
print(round(b_star(17.5, 1.0, 22.0)), round(b_star(4, 2.0, 22.0)))   # earlier table

# Sweep rate: bandwidth over capacity, per second
rubin = 19.2e3 / 288
lpu = 150e3 / 0.5
print(round(rubin, 1), round(lpu), round(lpu / rubin))

# Current for a 600 kW rack at 54 V and 800 V, and the resistive loss ratio
i54, i800 = 600e3 / 54, 600e3 / 800
print(round(i54), round(i800), round((i54 / i800) ** 2))

# Ohio: NVIDIA revenue per gigawatt ($B) and IT kW per GPU
print(round(150 / 4.25, 1), round(200 / 4.25, 1), round(4.25e6 / 1.5e6, 2))

# Water to remove 100 kW with a 10 K rise at 45 C (liters per minute)
print(round(100 / (4.18 * 10) / 0.990 * 60))
Glossary
Notes on the numbers
NVIDIA’s fiscal 2027 began on January 26, 2026, and its second quarter ended on July 26, 2026. Fiscal 2028 roughly corresponds to calendar 2027. Margins are GAAP throughout, because since the first quarter of fiscal 2027 NVIDIA’s non-GAAP measures include stock-based compensation and the historical non-GAAP figures were restated.
The fourth quarter trough and the fiscal 2028 range were given on the call without specifying GAAP or non-GAAP; the two measures were within 0.1 points of each other in each of the last two quarters.
The compute and networking split of Data Center was last given for the first quarter of fiscal 2027, rounded to $60.4 billion and $14.8 billion. The second quarter networking figure above is an estimate made here. Hyperscale and ACIE figures for the second quarter and the recast first quarter come from the second quarter commentary, and the as-reported first quarter figures come from the first quarter commentary.
Supply-related commitments are charted for the four quarters in which the commentaries used here report a total under that label. The first quarter of fiscal 2026 used a different definition, $29.8 billion of purchase commitments and obligations for inventory and manufacturing capacity, and is not charted.
Vera Rubin specifications are taken from NVIDIA’s product page as updated on September 11, 2026. The earlier values come from Spheron’s record of the page on August 16 and NVIDIA’s January technical blog, and the earlier scale-out figure from SiliconReport.
Transfer times assume each interconnect figure counts both directions and treat BlueField-4’s 800 Gb/s as one direction. Vera’s memory bandwidth comes from NVIDIA’s Rubin platform page, not from the NVL72 table.
Per-gigawatt revenue, the performance multipliers, the neocloud gigawatt figures and the hyperscaler capital expenditure figures are statements by NVIDIA, not audited numbers. The Kyber delay is a third-party report that NVIDIA has not confirmed. Values marked M in the dossier below are arithmetic on filed numbers, with the formula given.
Sources
NVIDIA, CFO Commentary on Second Quarter Fiscal 2027 Results (8-K exhibit), Aug 26, 2026. https://www.sec.gov/Archives/edgar/data/1045810/000104581026000073/q2fy27cfocommentary.htm
NVIDIA, press release: Financial Results for Second Quarter Fiscal 2027, Aug 26, 2026. https://nvidianews.nvidia.com/news/nvidia-announces-financial-results-for-second-quarter-fiscal-2027
NVIDIA Q2 FY2027 earnings call, corrected transcript (FactSet, hosted by NVIDIA IR), Aug 26, 2026. https://s201.q4cdn.com/141608511/files/content_files/TRANSCRIPT_-NVIDIA-Corp-NVDA-US-Q2-2027-Earnings-Call-26-August-2026-5_00-PM-ET.pdf
NVIDIA, CFO Commentary on First Quarter Fiscal 2027 Results, May 2026. https://s201.q4cdn.com/141608511/files/doc_financials/2027/Q127/Q1FY27-CFO-Commentary.pdf
NVIDIA, CFO Commentary on Fourth Quarter and Fiscal 2026 Results (8-K exhibit), Feb 25, 2026. https://www.sec.gov/Archives/edgar/data/1045810/000104581026000019/q4fy26cfocommentary.htm
NVIDIA, CFO Commentary on Third Quarter Fiscal 2026 Results (8-K exhibit), Nov 19, 2025. https://www.sec.gov/Archives/edgar/data/1045810/000104581025000228/q3fy26cfocommentary.htm
NVIDIA, CFO Commentary on First Quarter Fiscal 2026 Results, May 2025. https://s201.q4cdn.com/141608511/files/doc_financials/2026/Q126/Q1FY26-CFO-Commentary.pdf
NVIDIA, press release: Financial Results for Second Quarter Fiscal 2026 (8-K exhibit), Aug 27, 2025. https://www.sec.gov/Archives/edgar/data/1045810/000104581025000207/q2fy26pr.htm
NVIDIA, Form 10-Q for the quarter ended July 26, 2026, Aug 2026. https://www.sec.gov/Archives/edgar/data/0001045810/000104581026000075/nvda-20260726.htm
NVIDIA, Form 8-K on the SB Energy residual value guaranties, Aug 17, 2026. https://www.sec.gov/Archives/edgar/data/1045810/000104581026000069/nvda-20260817.htm
NVIDIA, press release: NVIDIA Guarantees SB Energy’s PORTS-Pike Technology Campus, Aug 17, 2026. https://nvidianews.nvidia.com/news/nvidia-guarantees-sb-energy-s-ports-pike-technology-campus-in-ohio-to-exclusively-host-nvidia-ai-compute
NVIDIA, press release: compute financing platforms with Apollo, BlackRock, Blackstone, Brookfield, Goldman Sachs and KKR, Aug 10, 2026. https://nvidianews.nvidia.com/news/nvidia-partners-with-apollo-blackrock-blackstone-brookfield-goldman-sachs-and-kkr-to-establish-ai-compute-infrastructure-financing-platforms-to-mobilize-over-500-billion-of-third-party-capital
NVIDIA, press release: Vera Rubin Ramps Into Full Production, May 31, 2026. https://nvidianews.nvidia.com/news/vera-rubin-full-production-agentic-ai-factory
NVIDIA, Vera Rubin NVL72 product page and specifications table, updated Sep 11, 2026, accessed Sep 16, 2026. https://www.nvidia.com/en-us/data-center/vera-rubin-nvl72
NVIDIA Technical Blog, Inside the NVIDIA Vera Rubin Platform, Jan 5, 2026. https://developer.nvidia.com/blog/inside-the-nvidia-rubin-platform-six-new-chips-one-ai-supercomputer/
NVIDIA, press release: NVIDIA DSX Gives Infrastructure Builders the Playbook for AI Factories, May 31, 2026. https://nvidianews.nvidia.com/news/dsx-infrastructure-ai-factory
NVIDIA Technical Blog, NVIDIA 800 VDC Architecture Will Power the Next Generation of AI Factories, updated Jan 14, 2026. https://developer.nvidia.com/blog/nvidia-800-v-hvdc-architecture-will-power-the-next-generation-of-ai-factories/
Tom’s Hardware, Nvidia’s Kyber rack for Rubin Ultra reportedly delayed to 2028 (reporting a SemiAnalysis thread; includes NVIDIA’s statement), Jul 6, 2026. https://www.tomshardware.com/pc-components/gpus/nvidias-kyber-rack-for-rubin-ultra-slips-to-2028
DCD, Nvidia’s Rubin Ultra NVL576 rack expected to be 600kW, GTC 2025 remarks. https://www.datacenterdynamics.com/en/news/nvidias-rubin-ultra-nvl576-rack-expected-to-be-600kw-coming-second-half-of-2027/
NVIDIA, press release: Expands AI Infrastructure Capacity in Partnership With Australia’s Data Center Ecosystem, Sep 9, 2026. https://nvidianews.nvidia.com/news/nvidia-expands-ai-infrastructure-capacity-in-partnership-with-australias-data-center-ecosystem
Investing.com, NVIDIA at Goldman Sachs Communacopia + Technology Conference (transcript summary), Sep 10, 2026. https://www.investing.com/news/transcripts/nvidia-at-goldman-sachs-conference-huang-sees-ai-buildout-still-early-93CH-4896555
Data Center Frontier, PORTS-Pike Takes Shape as an 8-GW AI Infrastructure Model, Aug 2026. https://www.datacenterfrontier.com/hyperscale/article/55398883/ports-pike-takes-shape-as-an-8-gw-ai-infrastructure-model
Tom’s Hardware, Nvidia shows off Rubin Ultra with 600,000-Watt Kyber racks (GTC 2025 coverage), Mar 19, 2025. https://www.tomshardware.com/pc-components/gpus/nvidia-shows-off-rubin-ultra-with-600-000-watt-kyber-racks-and-infrastructure-coming-in-2027
NVIDIA, Groq 3 LPX product page, updated Aug 24, 2026, accessed Sep 16, 2026. https://www.nvidia.com/en-us/data-center/lpx/
Spheron, NVIDIA Vera Rubin NVL72 guide (quotes the NVIDIA specification table as retrieved on Aug 16, 2026), Sep 2026. https://www.spheron.network/blog/nvidia-vera-rubin-nvl72-guide/
VideoCardz, NVIDIA Vera Rubin NVL72 Detailed (CES 2026 specifications), Jan 6, 2026. https://videocardz.com/newz/nvidia-vera-rubin-nvl72-detailed-72-gpus-36-cpus-260-tb-s-scale-up-bandwidth
Fierce Network, Supercomputers can stay chill with hot water says Nvidia (CES 2026 keynote remarks), Jan 2026. https://www.fierce-network.com/cloud/nvidia-has-no-chill
SiliconReport, Nvidia Vera Rubin Explained (earlier scale-out figure and NVL144 naming history), Jul 3, 2026. https://www.siliconreport.com/nvidia-vera-rubin-everything-we-know-33727d4d
Thunder Compute, Nvidia Rubin Architecture (assembly time; quotes the earlier bandwidth figures), Sep 2026. https://www.thundercompute.com/blog/nvidia-rubin-architecture
NVIDIA, NVLink and NVLink Switch page (describes the NVLink figure as bidirectional), accessed Sep 16, 2026. https://www.nvidia.com/en-eu/data-center/nvlink
NVIDIA, Rubin platform page (Vera CPU memory bandwidth; cable-free trays, 18x faster assembly than Blackwell), accessed Sep 16, 2026. https://www.nvidia.com/en-eu/data-center/technologies/rubin/
Claim dossier
A: filed or official financial document. B: company statement or product claim, not independently verified. C: third-party reporting. M: computed here from the cited inputs, with the formula or method given. Source numbers refer to the Sources list above.
Results and guidance
Q2 FY27 revenue. $96,221M, up 18% q/q and 106% y/y. Source 1. Tier A.
Data Center revenue. $89,023M, up 18% q/q and 117% y/y. Source 1. Tier A.
Data Center share of revenue. 92.5% = 89,023 / 96,221; Q1 92.2%. Sources 1, 4. Tier M.
Edge Computing revenue. $7,198M, up 13% q/q and 27% y/y. Source 1. Tier A.
Revenue growth, y/y. Q1 FY26 69.2%, Q2 FY26 55.6%, Q3 FY26 62.5%, Q4 FY26 73.2%, Q1 FY27 85.2%, Q2 FY27 105.9%. Sources 1, 4, 5, 6, 7, 8. Tier M.
Q3 FY27 guidance. $108.0B plus or minus 2%; GAAP gross margin 74.0% plus or minus 50 bp. Source 1. Tier A.
Growth at the guide. 89.5% at midpoint, 93.2% at the top = guide / 57,006. Sources 1, 6. Tier M.
Revenue needed to keep accelerating. $117.3B = 57,006 x 96,221 / 46,743; 8.7% above midpoint. Sources 1, 6. Tier M.
Beats against guide midpoint. Q1 4.6% (guide $78.0B), Q2 5.7% (guide $91.0B). Sources 1, 4, 5. Tier M.
Fiscal 2028 outlook. About 70% revenue growth, supply-constrained. Source 3. Tier B.
China. Hopper shipments to China below 1% of Data Center revenue in Q2 (call); no China Data Center compute revenue in the Q3 outlook; $4.6B of H20 in Q1 FY26. Sources 2, 3, 7. Tiers A, B.
Customers
Hyperscale and ACIE, Q2 FY27. $48,710M and $40,313M. Source 1. Tier A.
Hyperscale and ACIE, Q1 FY27 as reported. $37,869M and $37,377M. Source 4. Tier A.
Hyperscale and ACIE, Q1 FY27 recast. $43,050M and $32,196M. Source 1. Tier A.
Revenue moved by the recast. $5,181M = 43,050 - 37,869; 6.9% of Q1 Data Center. Sources 1, 4. Tier M.
ACIE share of Data Center. 49.7% (Q1 reported), 42.8% (Q1 recast), 45.3% (Q2). Sources 1, 4. Tier M.
Neocloud capacity. About 3 GW at end of 2025; 8 GW expected at end of 2026. Source 3. Tier B.
Hyperscaler capital expenditure. Nearly $800B in 2026 and $1.3T in 2027 (top five); backlog above $2T. Source 3. Tier B.
AWS. Additional 2 million GPUs through Q2 FY2029. Source 3. Tier B.
Vera Rubin and the rack
Vera Rubin NVL72 specification (Sep 11 revision). 72 GPUs, 36 CPUs; 288 GB and 19.2 TB/s per GPU; 20.7 TB and 1,400 TB/s per rack; NVLink 3 TB/s and 216 TB/s; C2C 1.8 TB/s; 88 cores and 176 threads per CPU; up to 1.5 TB LPDDR5X per CPU, 54 TB per rack; scale-out 0.45 and 32.4 TB/s bidirectional; 1,296 NVIDIA and HBM4 chips; inlet 45 C. Source 14. Tier B.
Ratings per GPU. 50 PFLOPS NVFP4 inference (sparse); 35 NVFP4 training, 17.5 FP8/FP6, 4 BF16, 2 TF32 (dense); 130 TFLOPS FP32; 33 TFLOPS FP64. Source 14. Tier B.
Specification ratios. 12.5 = 3,600 / 288; 15.6% = 3 / 19.2; span 1,515 = 50,000 / 33; FP8/BF16 4.375; TF32/FP32 15.4; sparse/dense NVFP4 1.43. Source 14. Tier M.
HBM4 and memory bandwidth. HBM4 doubles HBM3e interface width; nearly 3x Blackwell memory bandwidth. Source 15. Tier B.
Vera Rubin shipments. Production shipments began in August; about 20% of Q3 Data Center revenue. Source 3. Tier B.
Vera Rubin revenue in Q3. About $20.0B = 108.0 x 0.925 x 0.20; Data Center about $99.9B. Sources 1, 3. Tier M.
Vera Rubin performance claims. Product page: up to 10x tokens per MW and one tenth cost per million tokens against GB200 NVL72 (Kimi-K2-Thinking 32K/8K), a quarter of the GPUs for a 10T MoE on 100T tokens, up to 35x per MW with LPX; call: 30x per MW and 35x lower token cost against Grace Blackwell Ultra; May: 10x agent throughput against Grace Blackwell. Sources 3, 13, 14. Tier B.
Grace Blackwell Ultra. GB300, the rack generation after GB200. Source 28. Tier C.
CPUs. Grace above $5B trailing twelve months; CPU revenue more than double in FY28. Source 3. Tier B.
Assembly and partners. Up to 18x faster assembly than Blackwell (January blog, Rubin page); over 1.5 hours to about 5 minutes (Thunder Compute); cable-free trays; more than 80 MGX partners. Sources 14, 15, 29, 31. Tiers B, C.
CES 2026. Vera Rubin described as in full production. Sources 26, 27. Tier C.
The revised table
Values before the revision. 22 TB/s and 1,580 TB/s HBM4; 260 TB/s NVLink per rack (page as retrieved Aug 16); 3.6 TB/s NVLink 6 per GPU (January blog); 28.8 TB/s scale-out per rack (July); compute and capacity as in January. Sources 15, 25, 26, 28. Tiers B, C.
Revision changes. HBM per GPU -12.7%; per rack -11.4%; NVLink per GPU -16.7%; per rack -16.9%; scale-out +12.5%. Sources 14, 25, 28. Tier M.
100 MW factory table. 40,000 GPUs with MaxLPS; 2 ZFLOPS NVFP4 inference; 1.4 ZFLOPS NVFP4 training; 700, 160, 80 EFLOPS; 12 PB HBM4 at 800 PB/s; up to 30 PB LPDDR5X; 42 PB fast memory. Source 14. Tier B.
Factory table check. 40,000 x 19.2 = 768 PB/s (listed 800); 40,000 x 22 = 880; rack product 1,382.4 against 1,400 (1.3%). Source 14. Tier M.
Critical batch B*. New: 455.7 (NVFP4, FP8 training), 208.3 (BF16, TF32); old: 397.7, 181.8; change 14.6%; sparse row refused (651 if forced). Sources 14, 25. Tier M.
Memory, bandwidth and SRAM
Bandwidth ladder. HBM4 / NVLink 6.4; / C2C 10.7; / Vera 16; / scale-out 42.7; NVLink / scale-out 6.67; BlueField-4 800 Gb/s = 0.1 TB/s. Sources 13, 14, 26. Tier M.
Vera memory bandwidth. Up to 1.2 TB/s (Rubin platform page; also reported from CES). Sources 26, 31. Tier B.
Transfer times for 100 GB. NVLink 67 ms, C2C 111 ms, scale-out 444 ms (figures halved as bidirectional, per the product page and the NVLink page); BlueField-4 1 s; HBM4 read 5.2 ms. Sources 13, 14. Tier M.
Fast memory per rack. 20.7 + 54 = 74.7 TB. Source 14. Tier M.
Groq 3 LPX. 256 LPUs; 500 MB SRAM, 150 TB/s SRAM bandwidth, 2.5 TB/s scale-up per LPU; 128 GB SRAM, 12 TB DDR5, 40 PB/s, 640 TB/s per rack. Source 24. Tier B.
LPX rack checks. 256 x 0.5 = 128 GB; 256 x 2.5 = 640 TB/s; 256 x 150 = 38.4 PB/s against 40 listed. Source 24. Tier M.
Sweep rates. Rubin 66.7/s; LPU 300,000/s; ratio 4,500; Vera 0.8/s. Sources 14, 24, 26. Tier M.
LPX against NVL72. Capacity 161.7x lower (20,700 / 128 GB); bandwidth 27.8x higher (per-chip products; 28.6x with rounded rack figures). Sources 14, 24. Tier M.
Networking and Kyber
Networking revenue. Q3 FY25 $3.1B, Q4 FY25 $3.0B, Q1 FY26 $5.0B, Q2 FY26 $7.3B, Q3 FY26 $8.2B, Q4 FY26 $11.0B, Q1 FY27 $14.8B. Sources 4, 5, 6, 7. Tier A.
Networking share and growth. 8.5% to 19.7%; 4.89x from Q4 FY25 to Q1 FY27; FY26 $31.4B, up 142%. Sources 4, 5, 7. Tier M.
Q2 FY27 networking estimate. About $17.5B = 14.8 x 1.18. Sources 3, 4. Tier M.
Co-packaged optics claims. 200 Gb/s SerDes; 5x power efficiency, 5x uptime, 1.3x faster deployment. Source 13. Tier B.
Scale-out fabrics. Quantum-X800 InfiniBand and Spectrum-X Ethernet; ConnectX-9 SuperNICs and BlueField-4 DPUs in the rack. Source 14. Tier B.
Kyber. 600 kW per rack (GTC, March 2025); reported delay to 2028; 78-layer midplane; 144 against 72 packages; NVIDIA statement. Sources 18, 19, 23. Tier C.
Gigawatts, power and cooling
PORTS-Pike site. 4.25 IT-GW initial; option 3.75 IT-GW (press release), about 3.8 GW (CFO commentary); 8 IT-GW for OpenAI; 10 GW generation; $4.2B grid; $1.5B NVIDIA investment; phases from 2028. Sources 1, 11. Tier A.
NVIDIA revenue per generation at the site. About 1.5 million GPUs; $150B to $200B. Source 1. Tier B.
Per-gigawatt arithmetic. 35.3 to 47.1 $B/GW; 40 x 4.25 = 170; 352,941 GPUs/GW; 2.83 kW/GPU; $100,000 to $133,333 per GPU. Source 1. Tier M.
Revenue opportunity per gigawatt. Hopper $18B, Grace Blackwell $25B, Vera Rubin $40B. Source 3. Tier B.
Total investment per gigawatt. About $30B five years ago, about $60B today; 40 / 60 = 66.7%. Source 3. Tiers B, M.
Watts per GPU. Factory 2.50 kW (400,000 GPUs/GW); without full MaxLPS gain 3.50 kW; Ohio 2.83 kW, 88.2% of factory density. Sources 1, 14, 16. Tier M.
800 V DC. 54 V today; up to eight shelves; up to 64U; up to 200 kg; 85% more power; 45% less copper; up to 5% efficiency; timing tied to Kyber. Source 17. Tier B.
Current and loss arithmetic. 11,111 A at 54 V; 750 A at 800 V; 14.81x; 219.5x. Sources 17, 19. Tier M.
DSX MaxLPS. 45 C cooling; up to 40% more GPUs; break-even loss 28.6% = 1 - 1/1.4. Source 16. Tiers B, M.
45 C water and chillers. Rack inlet 45 C (product page); Huang at CES: twice the power of Grace Blackwell, same 45 C water, no chillers needed. Sources 14, 27. Tiers B, C.
Water flow. 100 kW / (4.18 x 10 K) at 0.990 kg/L = 145.0 L/min; at 20 K 72.5 L/min. Source: textbook constants. Tier M.
Australia. Up to 2 GW by 2027 with eight operators. Source 20. Tier B.
AI infrastructure by 2030. $3T to $4T, repeated at Goldman Sachs conference. Source 21. Tier C.
Supply, memory costs and margins
Supply-related commitments. Q3 FY26 $50.3B, Q4 FY26 $95.2B, Q1 FY27 $119B, Q2 FY27 $279B. Sources 1, 4, 5, 6. Tier A.
Supply commitments due by FY2029. $267B of $279B (95.7%). Source 1. Tier M.
Cancelability of supply agreements. Some agreements may be cancelable, rescheduled or adjusted before firm orders. Source 9. Tier A.
Cost of revenue at the Q3 guide. $28.08B = 108.0 x (1 - 0.74); 92 / 28.08 = 3.28 quarters; two quarters 56.16. Source 1. Tier M.
Inventory. Q3 FY26 $19.8B, Q4 FY26 $21.4B, Q1 FY27 $25.8B, Q2 FY27 $31.6B. Sources 1, 4, 5, 6. Tier A.
Gross margin path. Q4 FY27 trough 71% to 72%; FY28 72% to 73%. Source 3. Tier B.
GAAP gross margin history. Q3 FY25 74.6%, Q4 FY25 73.0%, Q1 FY26 60.5%, Q2 FY26 72.4%, Q3 FY26 73.4%, Q4 FY26 75.0%, Q1 FY27 74.9%, Q2 FY27 75.0%. Sources 1, 4, 5, 6, 7, 8. Tier A.
Cost per $100 of revenue. 25.00, 26.00, 28.50, 27.50; up 4%, 14%, 10%. Sources 1, 3. Tier M.
Commitments, guarantees and financing
Commitments. 279 + 29 + 25 + 25 + 8 = $366B. Source 1. Tier A.
Additional commitments. 36 + 20 = $56B. Source 1. Tier A.
Guarantees. 3.5 + 105.0 = $108.5B. Source 1. Tier A.
Total against liabilities and revenue. $530.5B; 5.81x of $91.3B; 1.75x of $303.0B trailing revenue. Sources 1, 4, 5, 6. Tier M.
Residual value guaranties. Cap $105B; effective at lease commencement; ready-for-service expected from 2028; triggers and remedies. Source 10. Tier A.
Guarantee cap per gigawatt. $24.7B = 105 / 4.25; 52.5% to 70.0% of one generation’s revenue. Source 1. Tier M.
Lab exposure. Nearly $50B invested; about 12 GW for OpenAI; nearly 2 GW credit enhancement for another lab; labs about a quarter of next year’s business. Source 3. Tier B.
Financing platforms. More than $500B of third-party capital; MOUs subject to final agreements. Source 12. Tier B.
AI cloud agreements. Upfront sale plus revenue share above a take-or-pay floor. Sources 1, 3. Tier A.
Cash and balance sheet
Cash flow. Q2 net income $59,688M, OCF $24,077M, FCF $21,341M; OCF / net income 40.3% against 86.3% in Q1. Sources 1, 4. Tiers A, M.
Working capital in Q2. Receivables $22,346M, inventories $5,784M, prepaid and other $5,497M; equity gains $7,771M. Source 2. Tier A.
Days sales outstanding. 60 against 45; check 63,059 / 96,221 x 91 = 59.6. Source 1. Tiers A, M.
Marketable equity and non-marketable securities. 42,783 + 51,157 = $93,940M against $35,137M at Jan 25; cash and marketable debt $56,586M. Source 2. Tier M.
Equity activity, first half. Purchases $42,404M; net gains $23,707M. Source 2. Tier A.
Debt. $33,366M against $8,468M; $25.0B notes issued in Q2. Sources 1, 2. Tier A.
Groq payment. $2,944M in financing activities. Source 2. Tier A.
Capital returns. 19,732 + 6,047 = $25,779M; dividend $0.01 to $0.25 (May 18); $99.0B authorization remaining. Sources 2, 4. Tier A.
Buyback authorization. $80.0B added on May 18. Source 4. Tier A.
Dates
Dates. Q3 call November 17; GTC Berlin October 21. Source 3. Tier B.